
Introduction
Markets maintained their upward trajectory in October, with major indices establishing fresh record highs despite headwinds from a government shutdown and escalating trade tensions with China. The Federal Reserve’s second consecutive interest rate reduction contributed to declining yields, providing a tailwind for bond returns alongside equity gains.
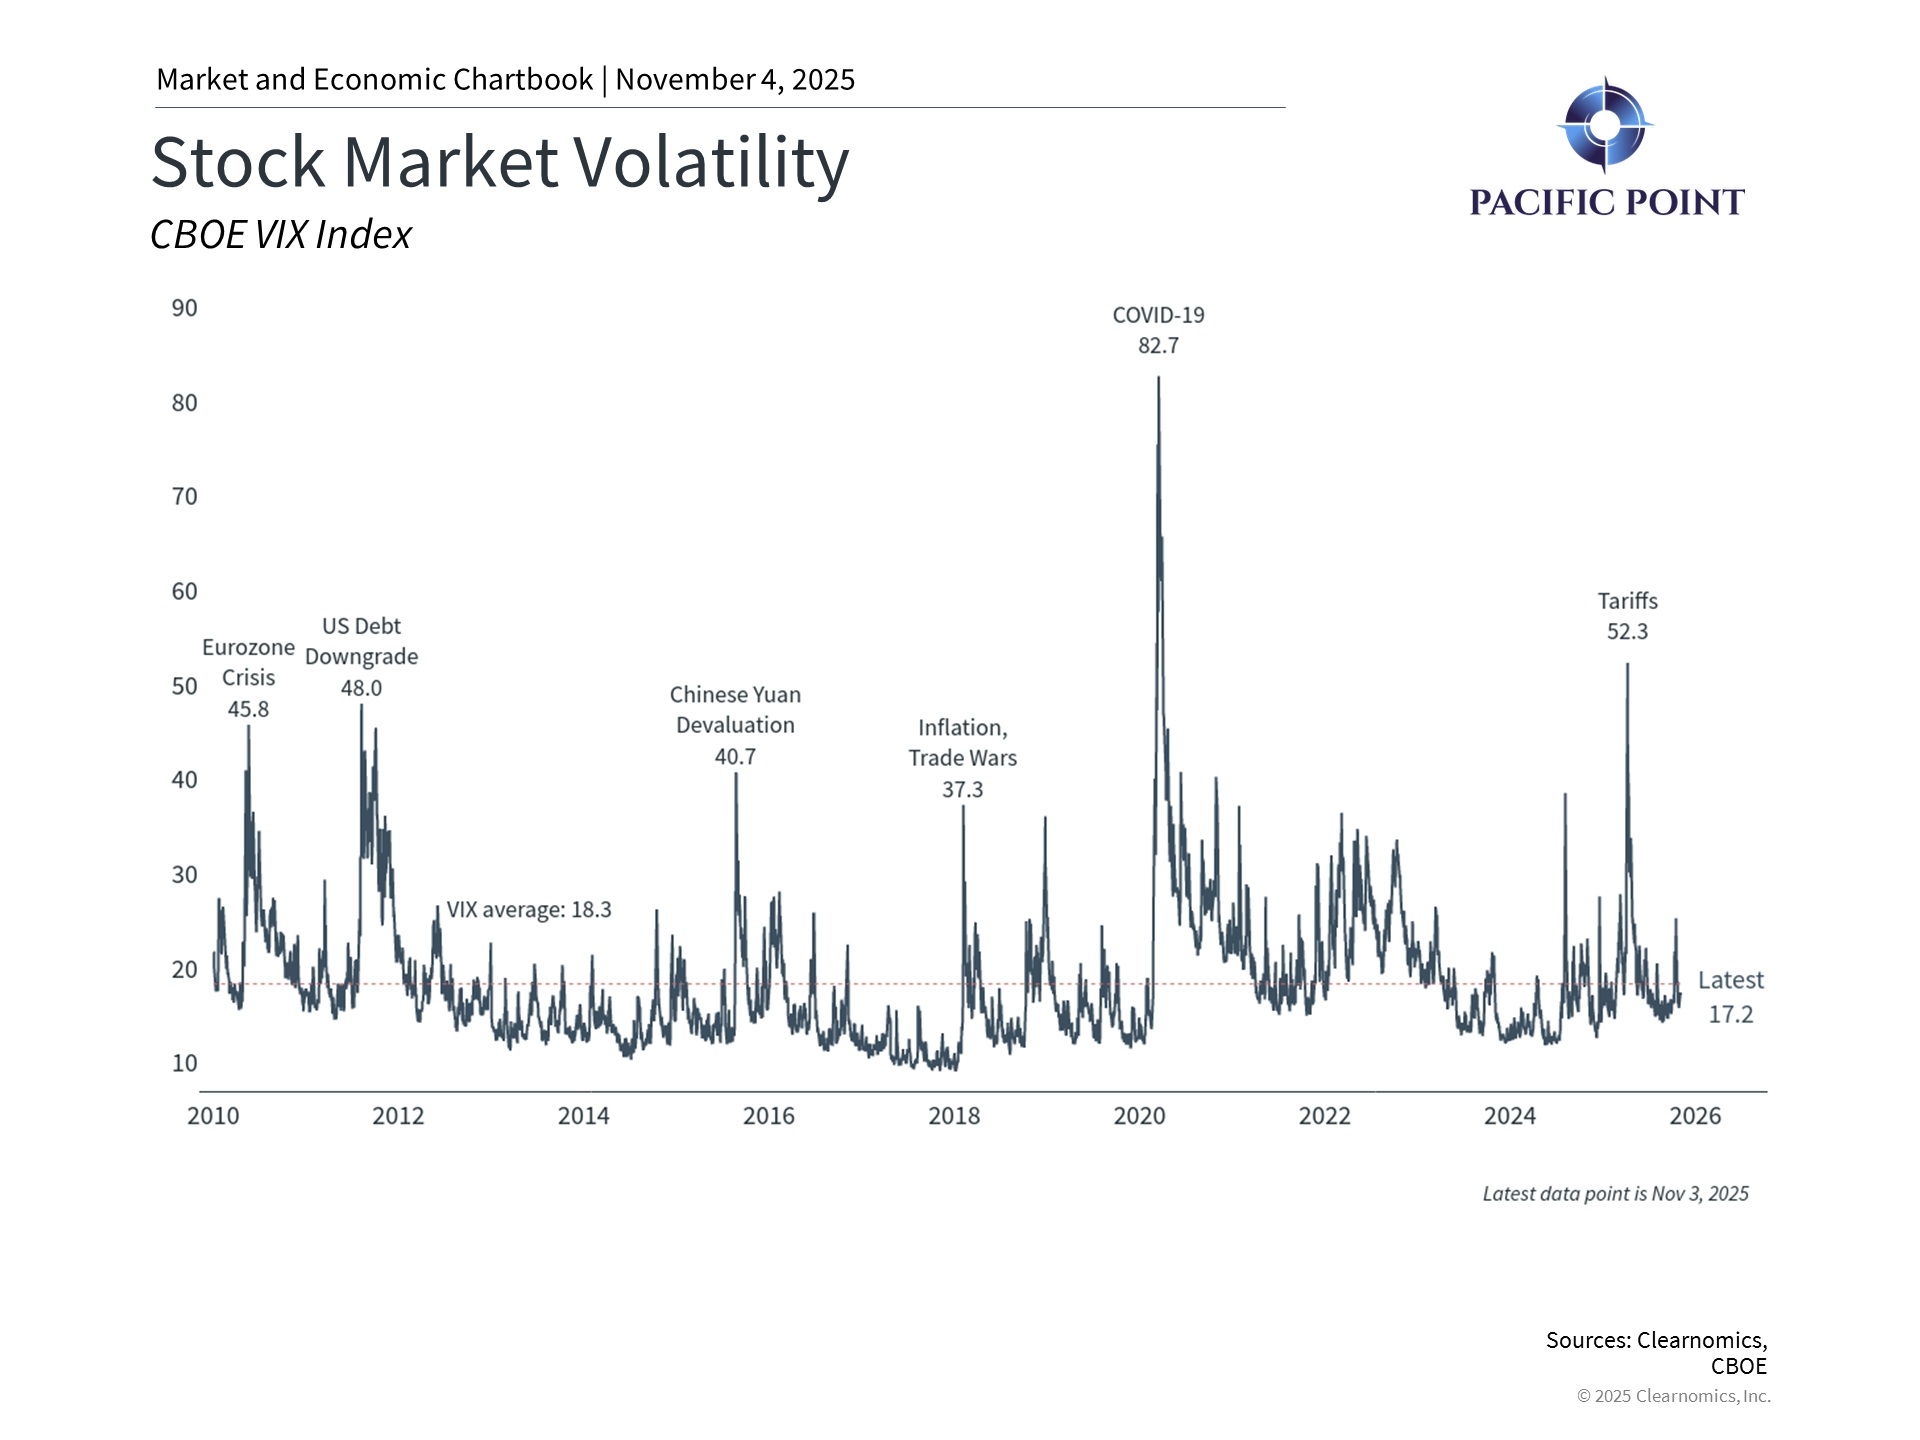
However, challenges emerged throughout the month. A dispute over rare earth metals triggered the sharpest single-day decline since April, while the prolonged government shutdown sparked economic concerns. Yet markets demonstrated resilience by recovering swiftly, highlighting the risk of making portfolio decisions based on short-term headlines. Gold reached unprecedented levels during this period before moderating.
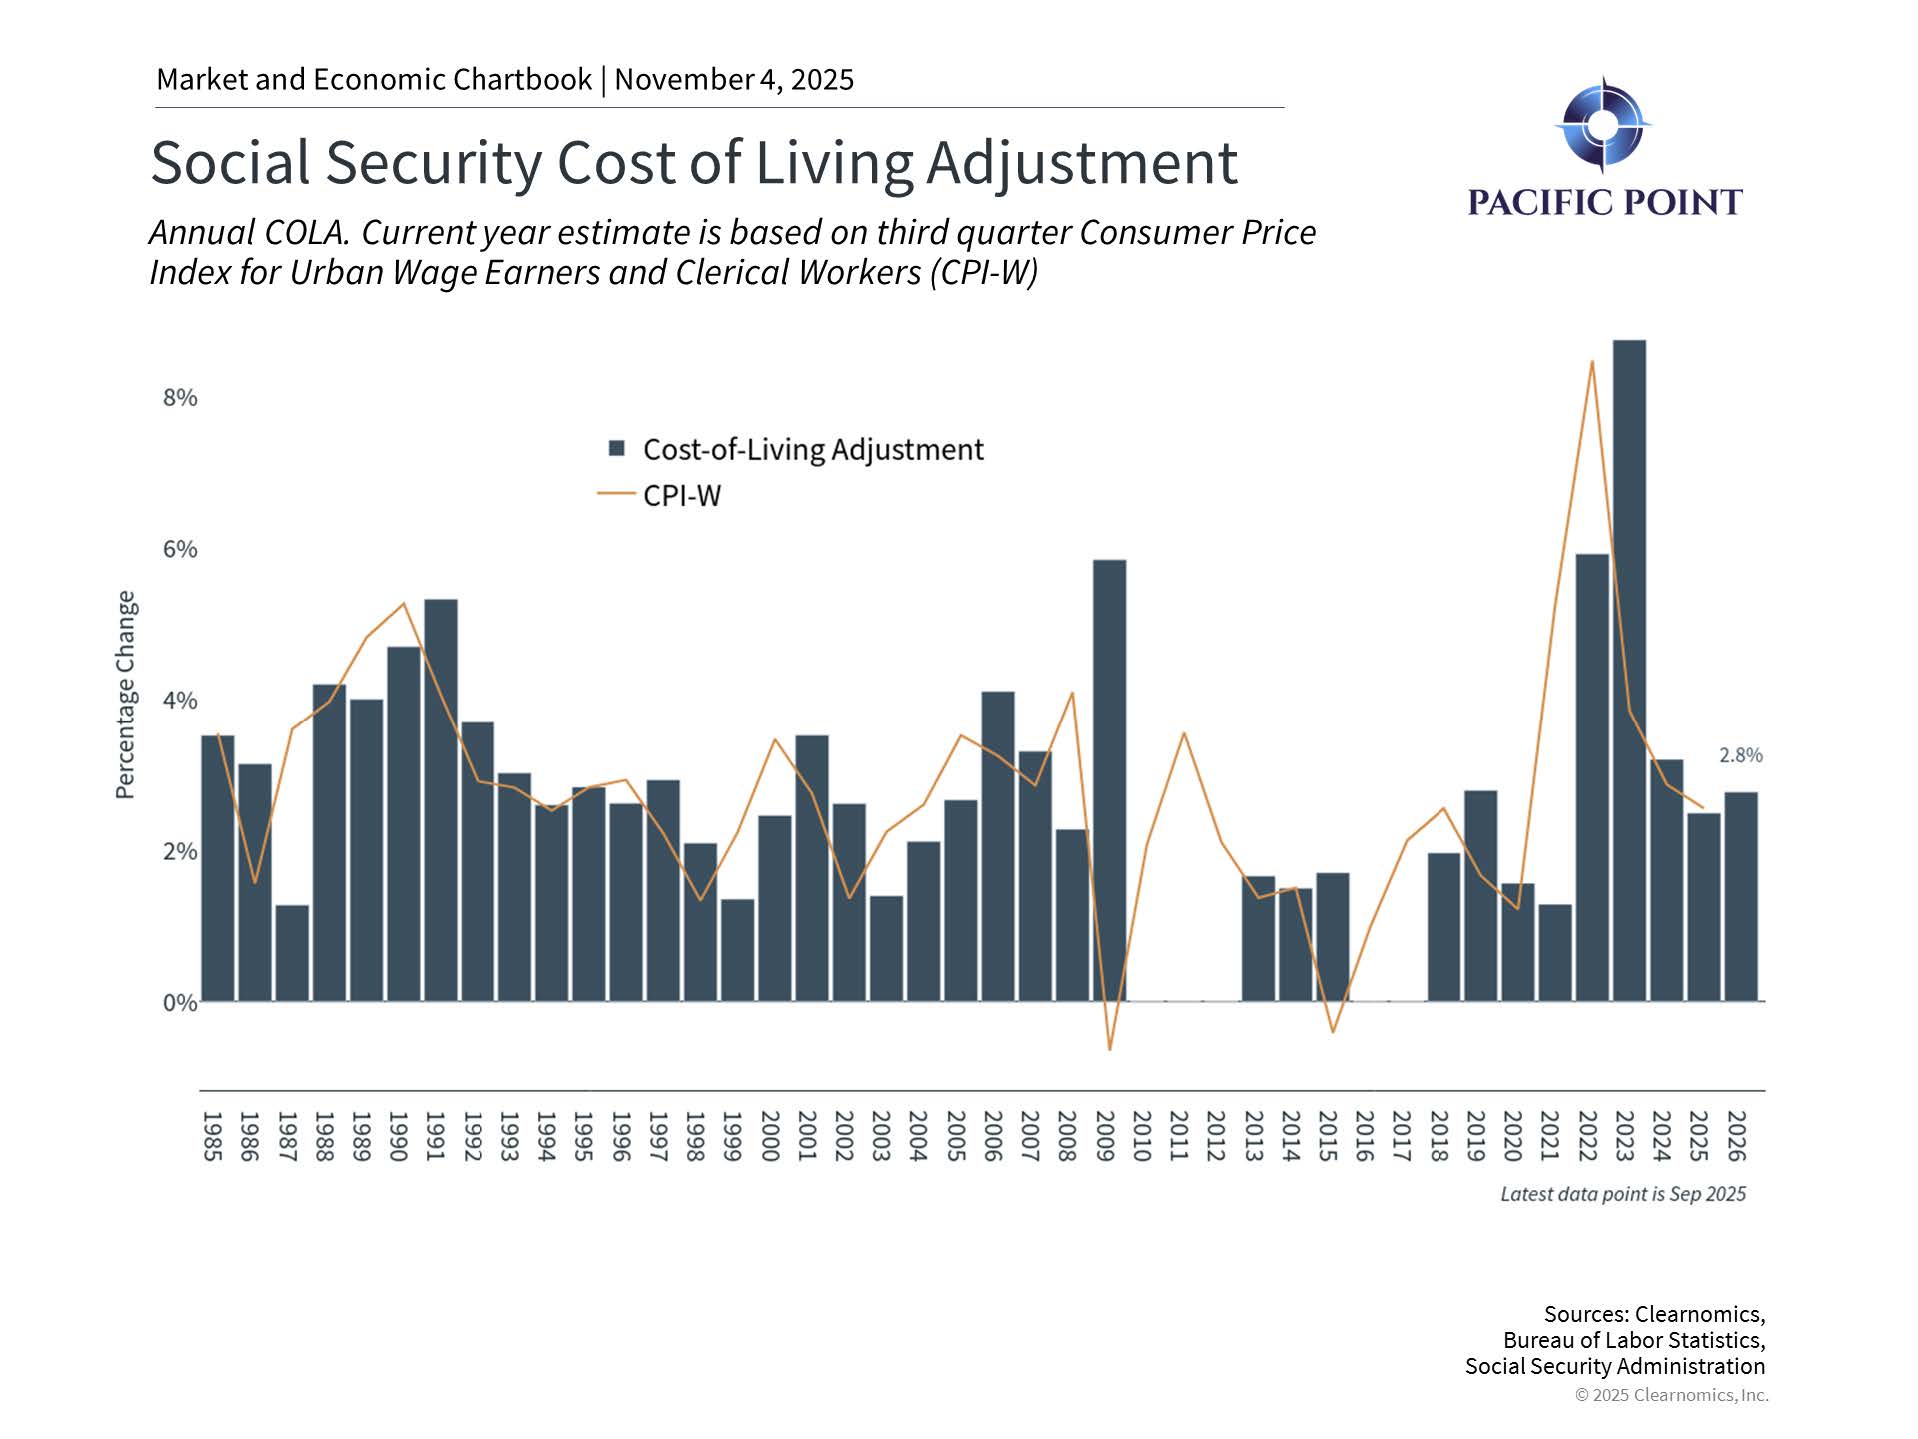
The Social Security Administration revealed a 2.8% cost-of-living adjustment for 2026, marking a notable decrease from recent years and potentially falling short of actual expense increases facing retirees. When combined with declining yields on cash investments, this development emphasizes the necessity of maintaining diversified portfolios that offer both income generation and capital appreciation potential.
Key Market and Economic Drivers
- The S&P 500 rose 2.3% in October, the Dow Jones Industrial Average 2.5%, and the Nasdaq 4.7%. Year-to-date, the S&P 500 is up 16.3%, the Dow is up 11.8%, and the Nasdaq is up 22.9%.
- The Bloomberg U.S. Aggregate Bond Index gained 0.6% in October. The 10-year Treasury
yield ended the month lower at 4.08%. - International developed markets gained 1.1% in U.S. dollar terms using the MSCI EAFE index, while emerging markets jumped 4.1% based on the MSCI EM index. Year-to-date, the MSCI EAFE index has gained 23.7% and the MSCI EM index 30.3%.
- The U.S. dollar index stabilized and rose slightly to 99.8.
- Bitcoin fell somewhat in October, ending the month at $109,428.
- Gold prices ended the month lower at $3,997, after reaching a new all-time high of $4,336
earlier in the month. - The Consumer Price Index was reported late due to the government shutdown, but showed that prices rose 3.0% on a year-over-year basis in September. This report is used to calculate the Social Security cost-of-living adjustment (COLA), which will be 2.8% in 2026.
- Other economic data, such as the monthly jobs report, has been delayed due to the
government shutdown.
Government operations disruption had limited market impact
The month opened with a government shutdown that has extended toward record
length. Historical evidence suggests these disruptions typically have minimal lasting
influence on financial markets, as government expenditures are generally deferred rather than eliminated. During the previous longest shutdown spanning 35 days in 2018-2019, the S&P 500 subsequently delivered a 31.5% gain in 2019.
Concerning workforce reductions, federal government employment accounts for merely 1.8% of total U.S. employment, while recent reduction-in-force notifications represent just 0.002% of the entire workforce. Although these developments create genuine hardships for affected individuals and disrupt services, their broader economic consequences remain constrained.
Trade policy uncertainty sparked temporary selloff
Tensions surrounding rare earth metals and potential 100% tariffs on Chinese goods triggered October’s most significant single-session decline. China maintains dominant control over roughly 70% of worldwide rare earth production and nearly 90% of processing capabilities. Following diplomatic engagement between Presidents Trump and Xi late in the month, tensions eased and tariffs on China were reduced by 10%.
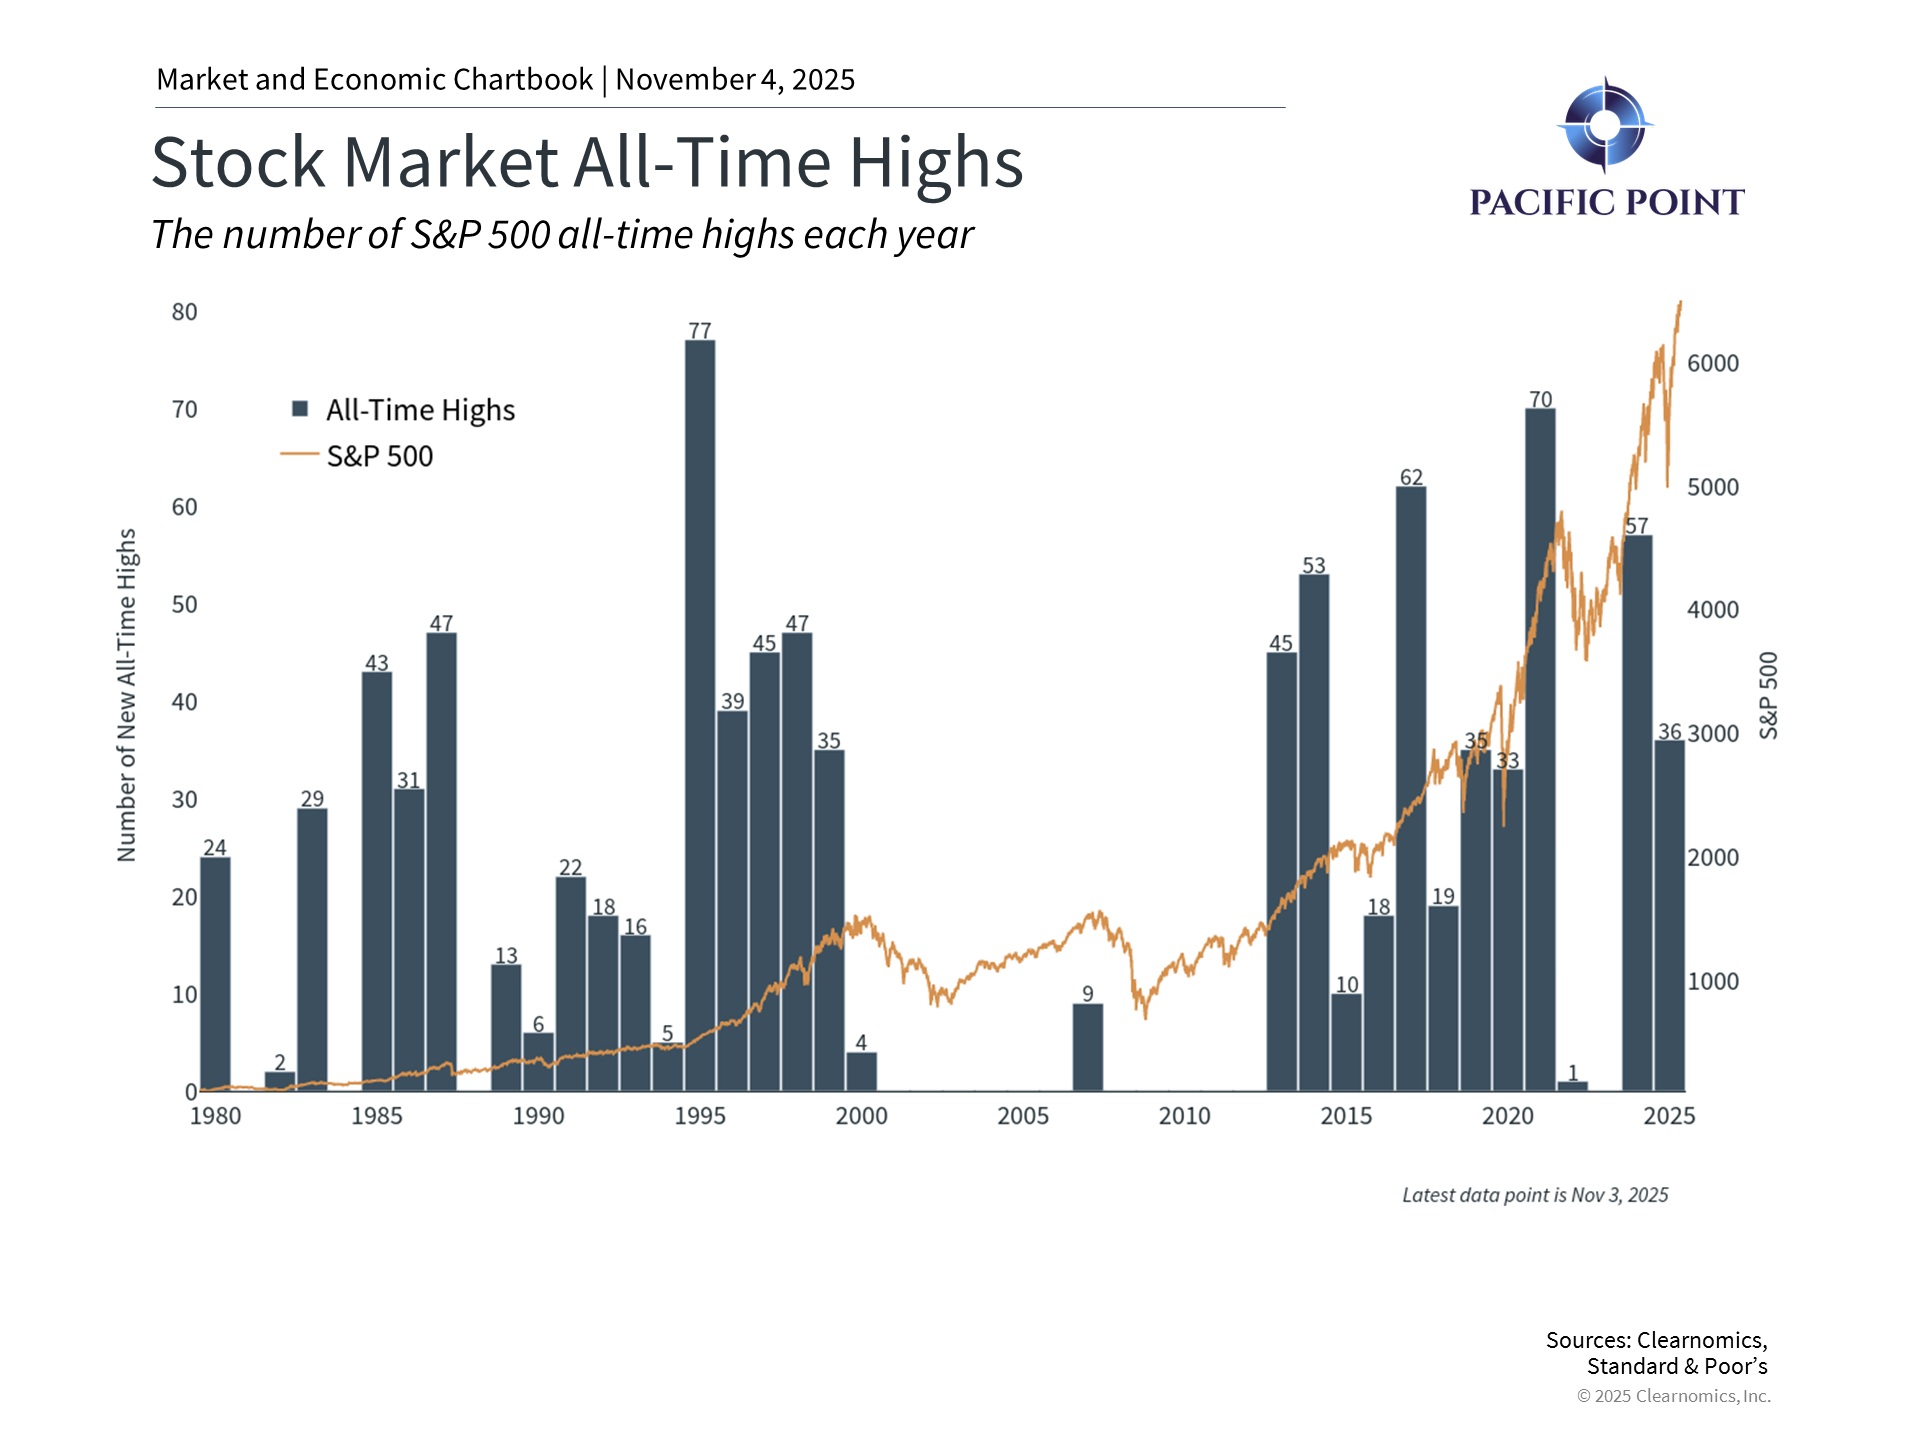
This volatility pattern has recurred throughout the year, with trade-related concerns prompting brief pullbacks before markets regain momentum. The S&P 500 has climbed 37% from its April trough and recorded 36 new all-time peaks through October, demonstrating that temporary fluctuations represent normal market behavior.
Monetary policy remains supportive
The Federal Reserve reduced interest rates by 0.25% in October to a range of 3.75% to 4.00%, continuing its accommodative stance. The Fed acknowledged elevated economic uncertainty and rising employment risks. Market participants anticipate another rate reduction by January, with one or two additional cuts possible in 2026. The Fed also announced it would cease balance sheet reduction in December, maintaining approximately $2.2 trillion in support after three years of tightening. Declining rates and accommodative policy have historically created favorable conditions across multiple asset classes.
Retirement planning faces headwinds from inflation dynamics
The 2026 Social Security cost-of-living adjustment of 2.8% will increase the average monthly benefit to approximately $2,064, representing a $56 increase. This modest adjustment significantly trails the 8.7% increase implemented in 2023. The challenge stems from the calculation methodology, which may not accurately reflect retiree spending patterns. Medical care services rose 3.9% annually, health insurance increased 4.2%, and home insurance climbed 7.5%, while meat, poultry, and fish prices jumped 6.0%.
With many retirees now living into their 90s, multi-decade retirement planning requires portfolios designed to deliver both steady income and long-term growth potential. Structuring portfolios for extended timeframes while managing distributions effectively underscores the importance of comprehensive financial planning.
THE BOTTOM LINE?
October’s market performance demonstrated resilience despite multiple headwinds. Maintaining a well-structured portfolio aligned with long-term objectives continues to be the most effective approach for navigating uncertainty.
Clearnomics Disclaimer
Copyright (c) 2025 Clearnomics, Inc. All rights reserved. The information contained herein has been obtained from sources believed to be reliable, but is not necessarily complete and its
accuracy cannot be guaranteed. No representation or warranty, express or implied, is made as to the fairness, accuracy, completeness, or correctness of the information and opinions contained herein. The views and the other information provided are subject to change without notice. All reports posted on or via www.clearnomics.com or any affiliated websites, applications, or services are issued without regard to the specific investment objectives, financial situation, or particular needs of any specific recipient and are not to be construed as a solicitation or an offer to buy or sell any securities or related financial instruments. Past performance is not necessarily a guide to future results. Company fundamentals and earnings may be mentioned occasionally, but should not be construed as a recommendation to buy, sell, or hold the company’s stock. Predictions, forecasts, and estimates for any and all markets should not be construed as recommendations to buy, sell, or hold any security–including mutual funds, futures contracts, and exchange traded funds, or any similar instruments. The text, images, and other materials contained or displayed in this report are proprietary to Clearnomics, Inc. and constitute valuable intellectual property. All unauthorized reproduction or other use of material from Clearnomics, Inc. shall be deemed willful infringement(s) of this copyright and other proprietary and intellectual property rights, including but not limited to, rights of privacy. Clearnomics, Inc. expressly reserves all rights in connection with its intellectual property, including without limitation the right to block the transfer of its products and services and/or to track usage thereof, through electronic tracking technology, and all other lawful means, now known or hereafter devised. Clearnomics, Inc. reserves the right, without further notice, to pursue to the fullest extent allowed by the law any and all criminal and civil remedies for the violation of its rights.