
Introduction
For more than a decade, analysts and investors have cautioned that the S&P 500’s valuations were elevated by historical standards. Ultra-low interest rates, strong consumer demand, Fed balance sheet expansion and flows into passive investment vehicles allowed multiples to climb, while robust profit margin growth and AI-driven CAPEX added further support. Those tailwinds are now fading, leaving valuations high just as fundamental and macro headwinds build.
Historical Valuation Observations Since the Great Financial Crisis
- Post-Financial Crisis Recovery (2012–2015): Valuation concerns emerged as multiples expanded more quickly than earnings. Critics pointed out PE ratios already stretching beyond long-term averages.
- Pre-Pandemic Cycle (2017–2019): The Shiller CAPE ratio stayed above 30, levels historically associated with low forward returns, while market leadership narrowed to a handful of mega-cap technology and consumer platform companies.
- Pandemic Era (2020–2021): Aggressive policy support sent valuations above 20x forward earnings, often compared to the late-1990s bubble.
- Monetary Normalization (2022-2024): Inflation drove rate hikes, while trillions in fiscal spending fueled liquidity, pushing valuations even higher.
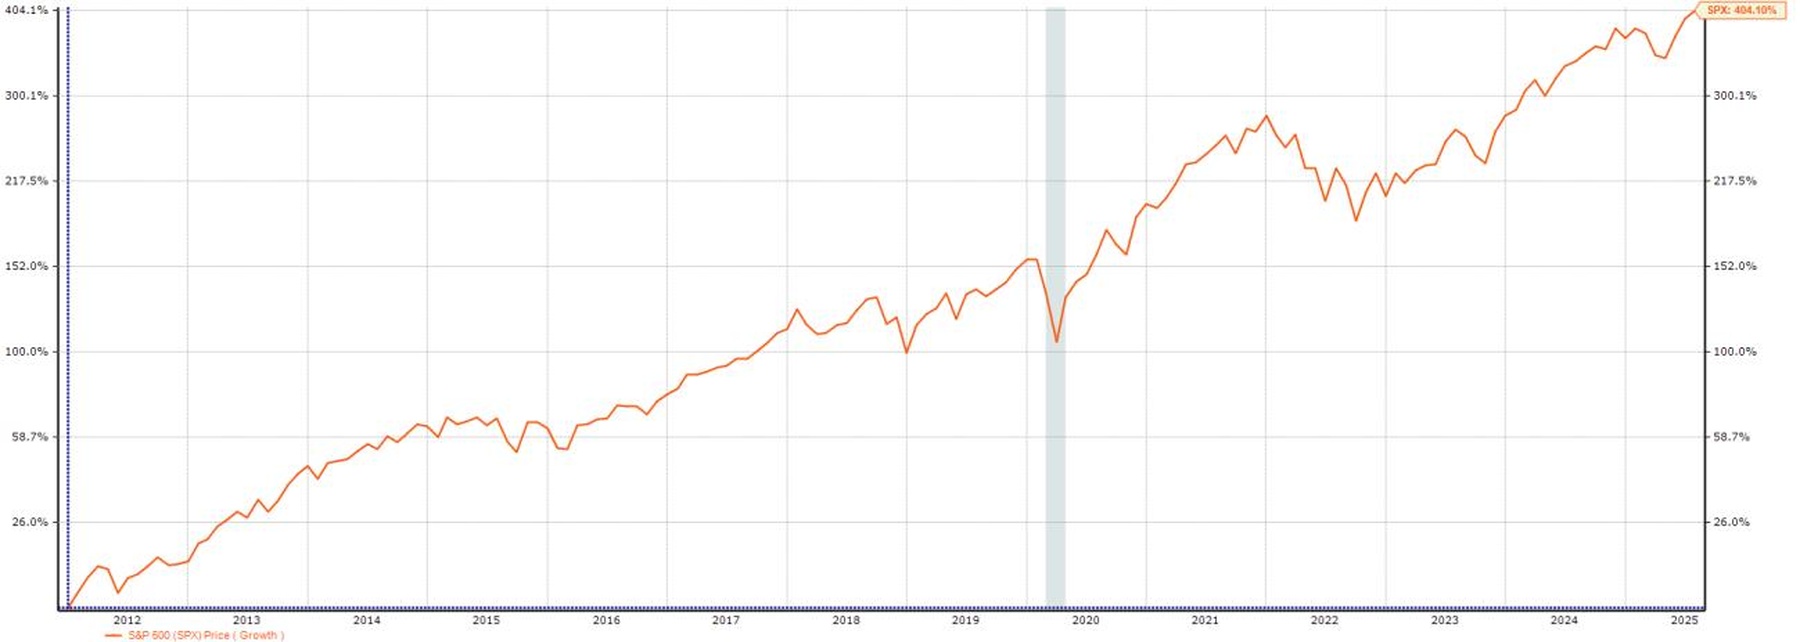
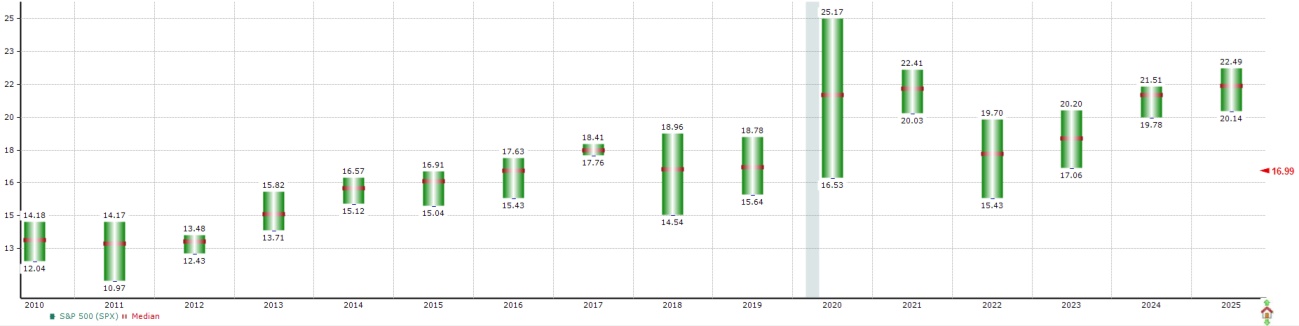
S&P 500 (SPX) Price Growth Since 2012
Impact of the Lack of an Extended Cumulative Drawdown After the Great Financial Crisis
The chart below illustrates historical drawdowns for the S&P 500 since the Great Depression and highlights that the market has experienced many prolonged downturns over the past century. Since the Great Financial Crisis, there has been a notable decline in:
- The number of drawdowns.
- The depth of drawdowns.
- The recovery time of drawdowns.
S&P 500 (SPX) Price and Cumulative Drawdown Since 1929
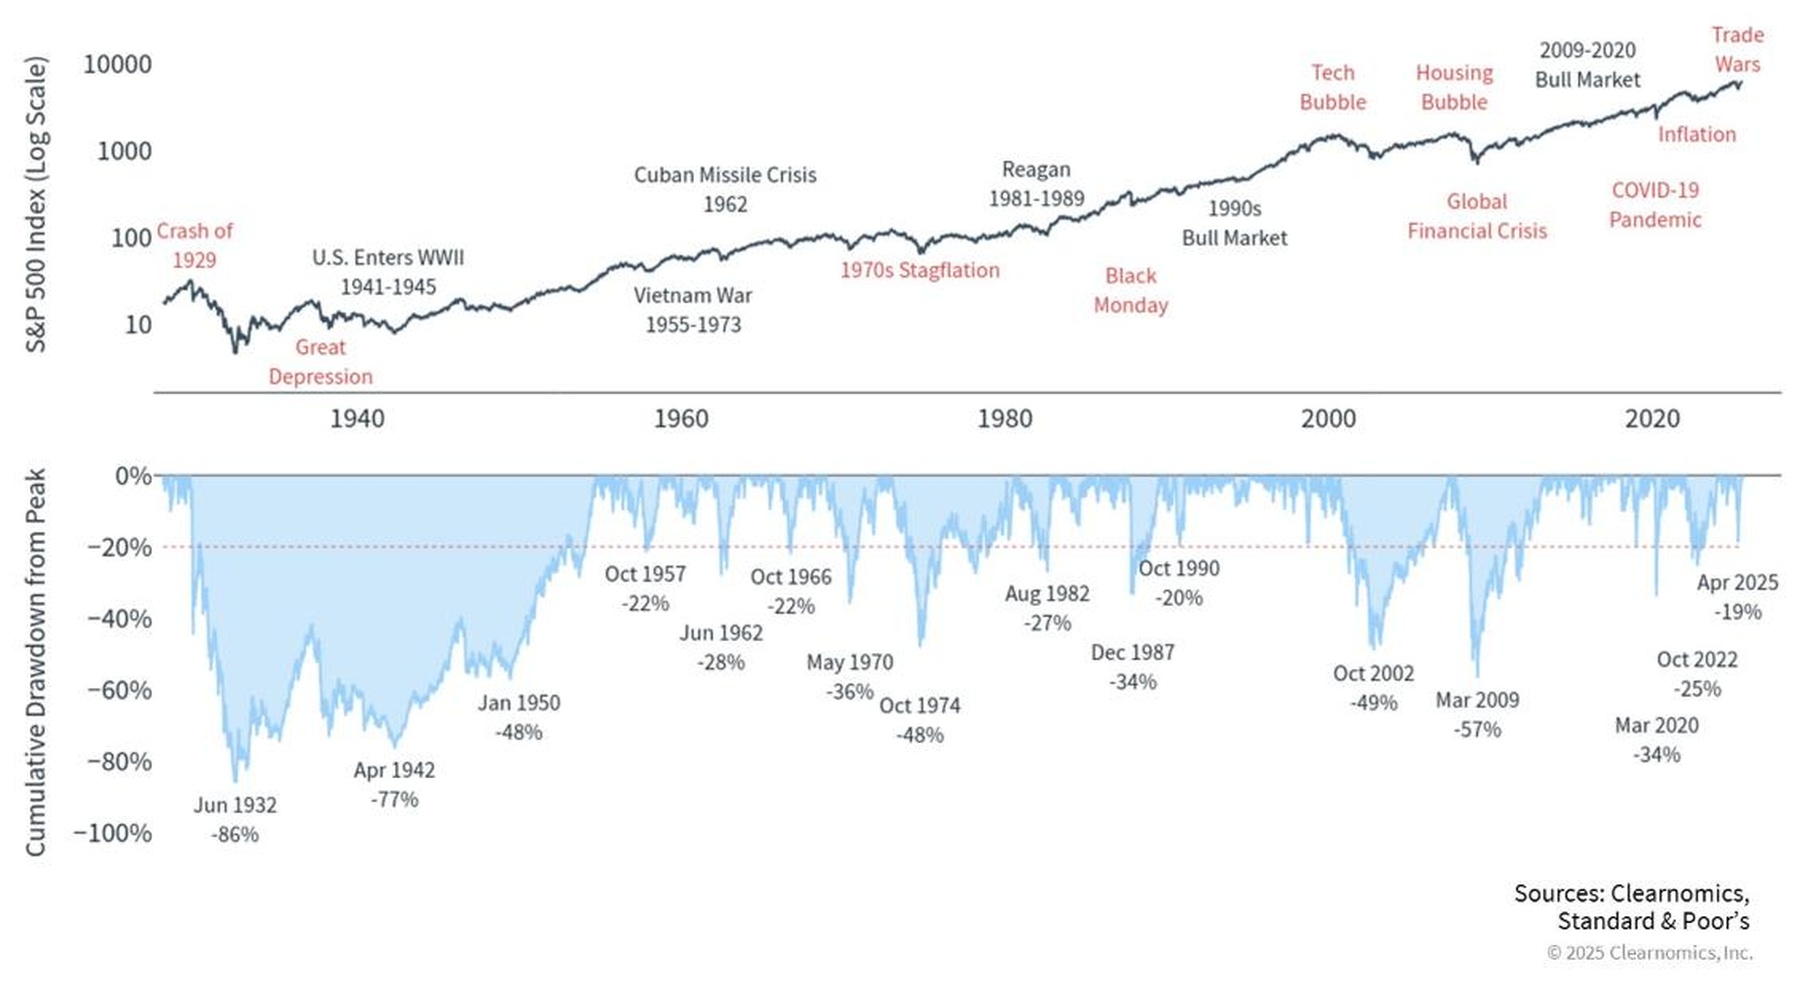
The Pacific Point Investment Committee believes that this lack of an extended cumulative drawdown period has resulted in persistent overvaluation that has made investors complacent, making the market increasingly vulnerable to slower growth, renewed inflation, or reduced risk appetite.
This historical perspective is important for investors to consider. Our research indicates that there is now an entire generation of investors that have never faced a multi-year drawdown, and most lack the emotional experience and discipline to manage their way through such a prolonged event.
Fundamental Evidence of Overvaluation
- Forward P/E Multiples: The index trades at 22.5x forward earnings versus a 15-year average of 17x. Even assuming earnings growth is sustainable, this multiple leaves little margin for error.
- Price-to-Sales Ratios: Now above 3.1x forward sales, surpassing dot-com bubble peaks, with half the revenue growth but margins twice as high as those seen in 2000.
- Profit Margins Under Pressure: Current corporate profit margins remain elevated by historical standards. Rising wage costs, higher interest expenses, and regulatory scrutiny threaten to erode margins, which would challenge earnings assumptions that justify current valuations.
- Market Concentration: The top ten predominantly mega-cap technology companies account for nearly 40% of the index’s market capitalization but only 33% of its profits. Such concentration raises risks of overvaluation spillover, as earnings and multiple compression in these firms could disproportionately affect index performance.
- Profit Margin Concentration: Since 2022, profit margin expansion has largely come from these top ten companies. Their consolidated annual revenue growth is more than 60% higher than the broader market over the same period. Such concentration raises risks of over-reliance on a few companies.
- Equity Risk Premium: The gap between the S&P 500’s earnings yield (~4.5%) and the 10-year U.S. Treasury yield (~4.1%) has compressed toward zero, signaling equities no longer offer a compelling risk-adjusted return advantage.
- Buffett Indicator (Market Cap-to-GDP): U.S. equity market capitalization remains above 200% of GDP, far above the long-term average near 100%. Historically, elevated readings have foreshadowed weaker forward returns.
- Shiller CAPE Ratio: Currently in the high-30s, compared to a long-term average of ~17x. Historically, CAPE readings above 30x have preceded periods of muted or negative real returns.
Market Concentration Risks are Expanding from Performance to Profit Margins
At Pacific Point, we deconstruct the S&P 500 to compare revenue growth rates and profit margins with and without the top 10 mega-cap technology companies. Our research indicates that since 2022, the market-weighted “S&P 490” has generated annual revenue growth at less than half the pace of the full S&P 500. This revenue gap has led to profit margin contraction across the S&P 490, while margins for the full index expanded to record highs.
The divergence stems from the tremendous operating leverage of the top 10 AI-driven mega-cap technology stocks. Their scale has allowed a greater share of revenue to flow through to profit margins at every level, pushing valuation multiples to record highs. Meanwhile, passive investment flows have disproportionately rewarded these companies, leaving them with nearly 40% of the index’s market capitalization but only about 33% of its profits.
Empirical Evidence Also Suggests Overvaluation
At Pacific Point, we model the historical performance of the S&P 500 and then use the current price to derive implied growth and earnings assumptions. As a point of reference, over the past 25 years, through three business cycles, the S&P 500 annual total return is roughly in line with the annual EPS growth rate of 6.6%.
At the current value of the S&P 500, investors are assuming there will be no future business cycle.
1. Long-term EPS growth vs. market expectations
- Zacks consensus EPS estimates for 2025 and 2026 are $268 and $300 respectively.
- History, incorporating the impact of business cycles, suggests that 6.6% annual EPS growth is a conservative growth rate when benchmarking forecast EPS growth assumptions.
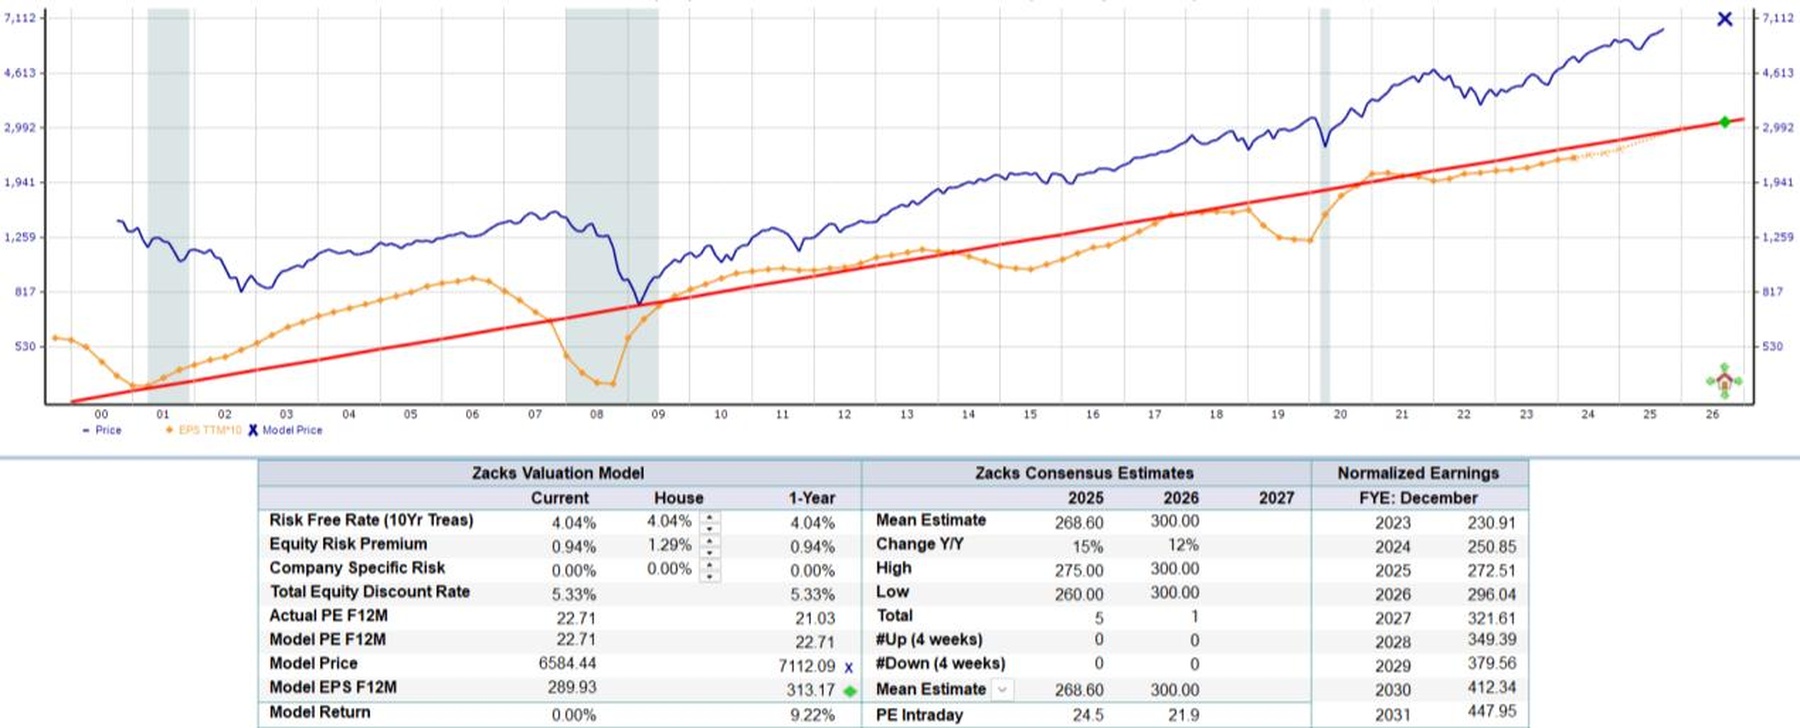
- Today, at a price of 6,500, the Zacks valuation tool produces a market-implied growth rate of 8.6% which implies little to no probability of a business cycle on the intermediate term horizon, over the next 3-7 years.
Valuation Model (EPS Lagged 1 Year)
S&P 500 (SPX) Market Implied EPS Growth Rate = 8.6%
2. Valuation using normalized growth assumptions
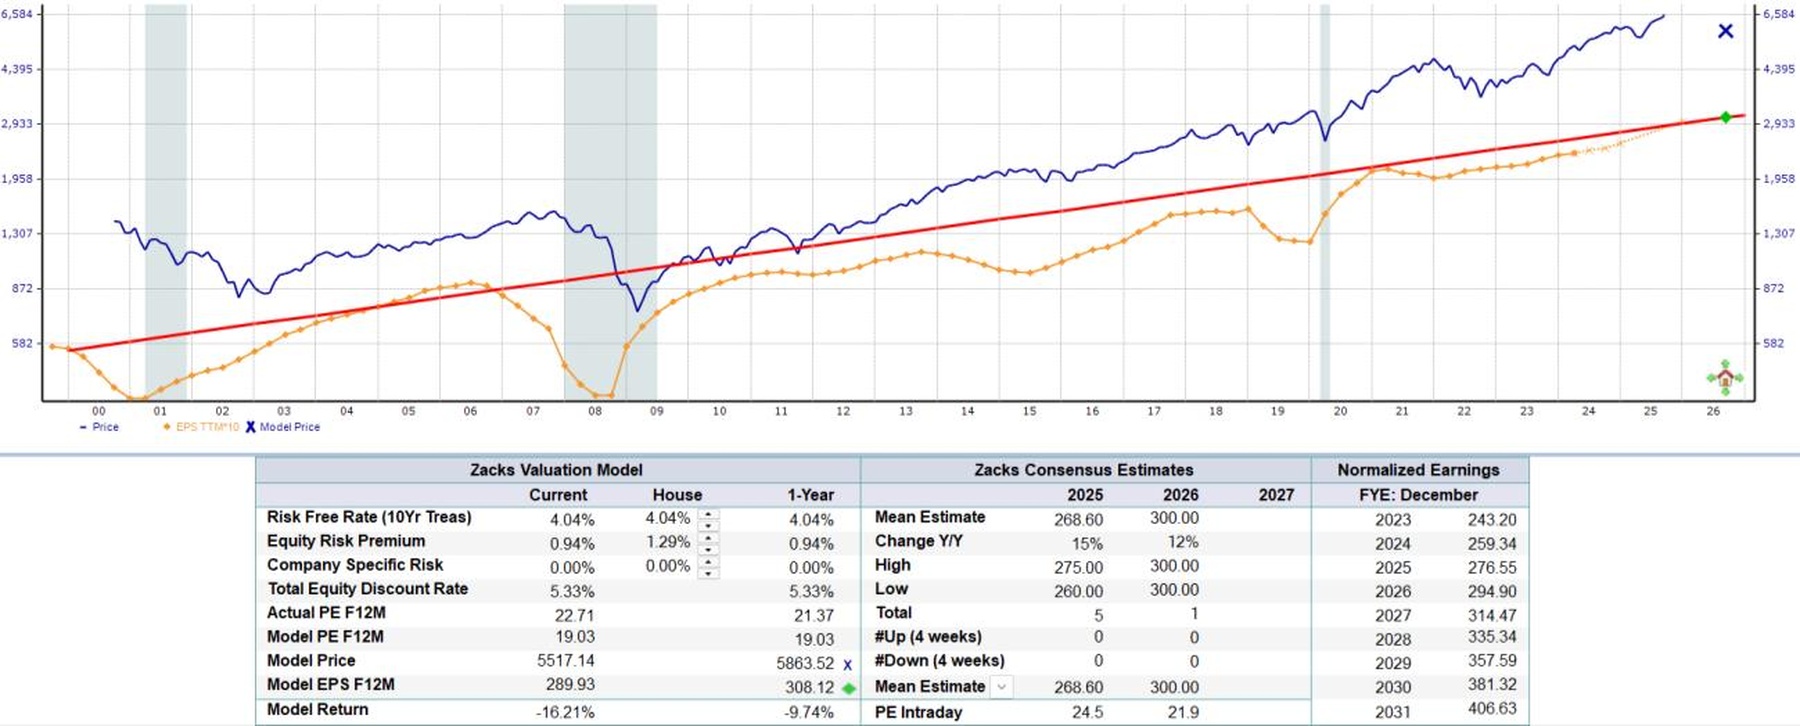
- Holding S&P 500 current price and Zacks consensus EPS estimates for 2025 and 2026 constant at 6,500, $268 and $300 respectively.
- Assuming the S&P 500 valuation reverts to a 6.6% conservative, long-term trend level of EPS growth, the Zacks valuation model produces a current fair value of 5,517 which represents a 16.2% decline from current price levels.
Valuation Model (EPS Lagged 1 Year)
S&P 500 (SPX) 25-Year Annual EPS Growth Rate = 6.6%
3. Forward 12-Month P/E Multiple (P/E F12M) – normalized valuation assumption
- The S&P 500 trades at 22.5x forward earnings versus a 15-year average of 17x.
- Holding S&P 500 the forward 12-month EPS estimate constant at $29.
- Assuming the P/E F12M reverts to long-term average levels of 17x, the current fair value of 4,976 represents a 24.5% decline from current price levels.
15-Year Average = 17x | S&P 500 (SPX) P/E F12M | Fair Value = 4,976 (-24.5%)
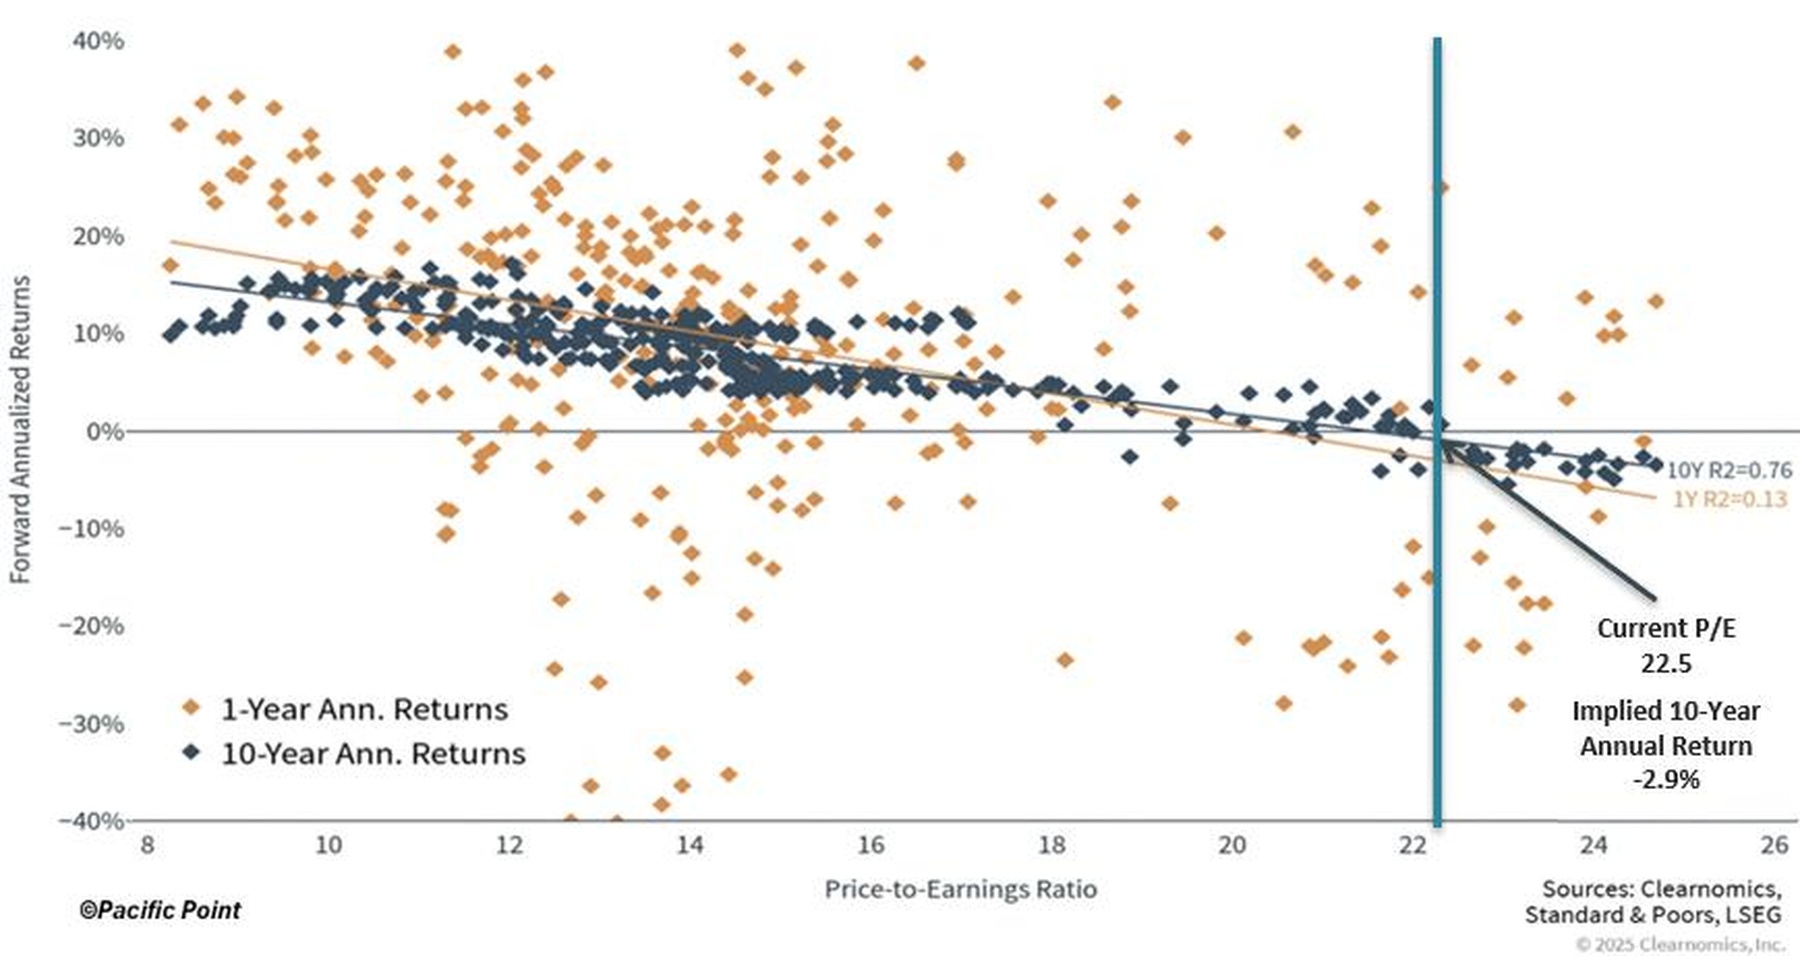
4. Forward P/E F12M vs. Subsequent Annualized Returns Since 1985
- Monthly forward P/E data for the S&P 500 since 1985 was plotted against subsequent 1-year and 10-year annualized returns to examine the relationship between valuations and future performance.
- Regression analysis indicates limited predictive power over short horizons (1-year R² = 0.13) but a strong relationship for long-term returns (10-year R² = 0.76), highlighting the greater importance of starting valuations over extended periods.
- At the current forward P/E of 22.5x, the implied 10-year annualized return is –2.9%, a level historically associated with peak household exposure to equities and elevated risk of lower long-term returns.
- As of Q2 2025, households hold a record proportion of their financial assets in equities, underscoring the potential vulnerability of highly concentrated stock allocations during periods of high valuation.
S&P 500 (SPX) Forward P/E Ratio and Subsequent Annualized Returns Since 1985
Valuation and Strategic Implications
The S&P 500’s current valuation rests on optimistic assumptions of uninterrupted earnings growth, high margin levels, and resilient consumer demand. Both fundamental measures and empirical models indicate downside risk of 16–25% if valuations revert to historical norms. While elevated multiples, narrow market leadership, and compressed risk premiums point to headwinds, short-term returns may remain strong despite stretched valuations, as regression analysis shows limited predictive power over 1-year horizons. Over longer periods, however, high starting valuations correlate with muted or negative annualized returns, a pattern historically tied to peak household equity exposure and the heightened vulnerability of concentrated stock allocations during periods of overvaluation.
Investor psychology further shapes market outcomes. Surveys indicate that investors consistently estimate the probability of a market crash within six months at 10–20%, often independent of fundamentals. Broader fear, whether driven by geopolitical shocks, natural disasters, or persistent media headlines, can amplify perceived risk and lead to reactive decision-making. Historical data indicates that broad crashes following rapid market growth are rare, yet downturns frequently coincide with recessions, forcing liquidity-constrained investors to sell at unfavorable prices.
These dynamics highlight the importance of aligning portfolios with realistic time horizons, maintaining disciplined investment practices, and treating risk management as a constant rather than a tactical adjustment. Emphasizing quality, valuation, and diversification can mitigate downside exposure while supporting long-term wealth accumulation. Reframing risk as a permanent but manageable feature of investing helps ensure that investors remain disciplined, stay invested, and ultimately benefit from the compounding power of equity markets.
The Solution for Staying Invested in an Overvalued Market
Effectively managing risk as a constant element allows investors to stay invested and avoid the pitfalls of trying to time the market, which rarely succeeds over the long term. That’s why it makes sense to focus on companies with strong fundamentals and efficient use of capital. Businesses that have consistently delivered stable earnings through different economic cycles can help protect your portfolio during periods of market volatility. By investing in these types of companies, investors reduce overall risk, increase diversification, and improve portfolio long-term risk-adjusted returns.
Consolidated earnings stability at the portfolio level has historically provided the Stable EarningsTM family of core equity portfolios with relative levels of downside protection against loss of capital during periods of market turbulence, economic recession and unforeseen events.
The Stable EarningsTM core equity portfolios are designed and maintained to deliver long-term equity market returns (or better) with lower volatility, lower drawdowns and reduced exposure to economic cycles and equity market concentration. The portfolios aim to provide peace of mind in turbulent markets and reduce emotional stress during extended periods of high volatility.
The Stable EarningsTM family of “core” equity portfolios are available in three different strategies: Core, Dividend and ESG.
The Stable EarningsTM core equity portfolios are designed and maintained to deliver long-term equity market returns (or better) with lower volatility, lower drawdowns and reduced exposure to economic cycles and equity market concentration. The portfolios aim to provide peace of mind in turbulent markets and reduce emotional stress during extended periods of high volatility.
General Disclaimer
This report is not an offer to sell securities of any investment fund, a solicitation of offers to buy any such securities, or a solicitation to open a separately managed account with Pacific Point Advisors, LLC (“Pacific Point”).
An investment in any strategy, including the Pacific Point Stable Earnings™ Stock Portfolio strategy (the “PSE”) described herein, involves a high degree of risk. The PSE is not an actual index but represents the hypothetical performance of a concentrated basket of stocks picked by Pacific Point, with the benefit of hindsight. There is no guarantee that the investment objective will be achieved. Past performance of these strategies is not necessarily indicative of future results. There is the possibility of loss, and all investment involves risk including the loss of principal.
The information in this presentation was prepared by Pacific Point and is believed by Pacific Point to be reliable and has been obtained from public sources believed to be reliable. Pacific Point makes no representation as to the accuracy or completeness of such information. Opinions, estimates and projections in this presentation constitute the current judgment of Pacific Point and are subject to change without notice. Any projections, forecasts and estimates contained in this presentation are necessarily speculative in nature and are based upon certain assumptions. It can be expected that some or all of such assumptions will not materialize or will vary significantly from actual results. Accordingly, any projections are only estimates and actual results will differ and may vary substantially from the projections or estimates shown. This presentation is not intended as a recommendation to purchase or sell any commodity or security. Pacific Point has no obligation to update, modify or amend this presentation or to otherwise notify a reader thereof in the event that any matter stated herein, or any opinion, project on, forecast or estimate set forth herein, changes or subsequently becomes inaccurate.
This research report is strictly confidential and may not be reproduced or redistributed in whole or in part nor may its contents be disclosed to any other person without the express consent of Pacific Point.
ALL STATEMENTS IN THIS PRESENTATION ARE THE OPINIONS OF PACIFIC POINT, UNLESS OTHERWISE SPECIFIED.
Additional Disclaimers
Disclaimer 1: Investment Strategy
The description herein of the approach of Pacific Point and the targeted characteristics of the PSE™ strategy and investments is based on current expectations and should not be considered definitive or a guarantee that the approaches, strategies, and investment portfolio will, in fact, possess these characteristics. In addition, the description herein of the PSE’s risk management strategies is based on current expectations and should not be considered definitive or a guarantee that such strategies will reduce all risk. These descriptions are based on information available as of the date of preparation of this document, and the description may change over time. Past performance, model performance, and back testing of these strategies is not necessarily indicative of future results. There is the possibility of loss and all investment involves risk including the loss of principal.
Disclaimer 2: Graphs and Charts
The graphs, charts and other visual aids are provided for informational purposes only. None of these graphs, charts or visual aids can and of themselves be used to make investment decisions. No representation is made that these will assist any person in making investment decisions and no graph, chart or other visual aid can capture all factors and variables required in making such decisions.
Disclaimer 3: Indices
References to market or composite indices, benchmarks, or other measures of relative market performance over a specified period of time may be presented to show general trends in the markets for the applicable period and are not intended to imply that the PSE is benchmarked to any indices either in composition or level of risk. Benchmark data is provided for comparative purposes only. Reference or comparison to an index does not imply that the portfolio will be constructed in the same way as an index or achieve returns, volatility, or other results similar to the index.
Indices are unmanaged, include the reinvestment of dividends and do not reflect transaction costs or any performance fees. Unlike indices, the PSE will be actively managed and may include substantially fewer and different securities than those comprising each index. Results for the PSE as compared to the performance of the Standard & Poor’s 500 Index (the “S&P 500”) is for informational purposes only. The S&P 500 is an unmanaged market capitalization-weighted index of 500 common stocks chosen for market size, liquidity, and industry group representation to represent U.S. equity performance. The PSE does not mirror this index and the volatility may be materially different than the volatility of the S&P 500.
Results for the PSE as compared to the performance of the Standard & Poor’s 500 Index (the “S&P 500”), is for informational purposes only. The S&P 500 is an unmanaged market capitalization-weighted index of 500 common stocks chosen for market size, liquidity, and industry group representation to represent U.S. equity performance. The PSE does not mirror this index and the volatility may be materially different than the volatility of the S&P 500.
Direct comparisons between the PSE’s performance and equity market indices are not without complications. The PSE’s portfolio may contain options and other derivative securities, fixed income investments, may include short sales of securities and margin trading and may not be as diversified as market indices. The indices may be unmanaged, may be market weighted, and unlike PSE, indices do not incur fees and expenses. Due to the differences among PSE’s portfolio and the performance of equity market indices, no such index is directly comparable to the PSE investment strategy.
Disclaimer 4 – Forward Looking Statements/Projections
Any projections, forecasts, objectives and estimates contained in this document are necessarily speculative in nature and are based upon certain assumptions. In addition, matters they describe are subject to known (and unknown) risks, uncertainties and other unpredictable factors, many of which are beyond Pacific Point’s control. No representations or warranties are made as to the accuracy of such forward-looking statements. It can be expected that some or all of such forward-looking assumptions will not materialize or will vary significantly from actual results. Accordingly, any projections are only estimates and actual results will differ and may vary substantially from the projections or estimates shown. This presentation cannot and does not guarantee or predict a similar outcome with respect to any future investment.
Disclaimer 5 – Behavioral Finance Statistic
All references to investor psychology and behavioral finance along with related statistics were based on research performed by Yale economist William Goetzmann.