
The Rationale For Excluding Bank and Financial Stocks From Our Stable Earnings™ Portfolios
Pacific Point Stable Earnings™ portfolio member companies are characterized by long-term earnings stability and a growth profile that is both sustainable and supportable in all economic environments. As a strict rule, Stable Earnings™ portfolio membership excludes interest rate and economic cycle-sensitive sectors, including banks and the entire financial sector. This white paper explains why we specifically exclude financials and how you can effectively use Stable Earnings™portfolios as a core equity allocation.
As shown below, banks and financial service companies tend to have a lower implied asset and earnings quality rating compared to the average industrial company. While many factors contribute to this reality, one of the most significant drivers is the fact that banks are typically leveraged 10:1 to regulatory capital. This leverage makes evaluating banks and financial companies highly subjective and more dependent on macroeconomic factors such as interest rates, credit quality, overall financial market liquidity, and regulatory changes. Historically, leverage has been the primary cause of most bank failures leading up to and during recessionary periods.
Investors in the Pacific Point Stable Earnings™ family of core equity portfolios take comfort knowing that the strategies maintain no exposure to bank stocks or the broader financial sector.
The following 25-year Price and Earnings chart for the equal-weighted Pacific Point – Regional and Money Center Bank Composite illustrates the price and earnings volatility associated with various phases of the economic cycle. Bank earnings collapsed during the Global Financial Crisis, and as a result, price and earnings are still struggling to recover to pre-Financial Crisis levels. As you can see, between 2008-2010, the aggregate index lost money. What is not shown is that many bank stocks went to zero.
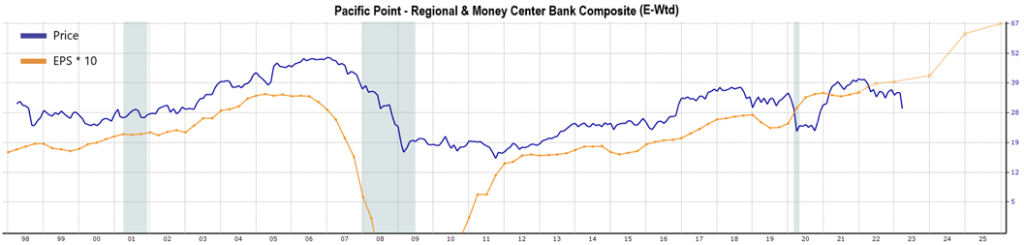
*Please see disclaimers 2, 3, and 4. Source: Zacks Research System
Bank earnings are volatile because they are largely dependent on the term structure of interest rates and the direction of the yield curve, making the banking industry one of the most economic cycle-sensitive industries in the S&P 500. The valuation of bank assets that appear to be of high quality during the early or mid-phase of an economic cycle can significantly differ from the same assets in a late-phase economic cycle with increasing interest rates.
The following chart adds the least squares regression trend line to EPS in red to illustrate the negative impact of earnings volatility on annual earnings growth. The 25-year annual EPS growth rate of 1.12% is represented by the slope of the least squares trend line. The net effect of bank earnings volatility over the past 25-years is a composite annual EPS growth rate that has not kept pace with U.S. inflation and a price that is essentially flat on a point-to-point basis.
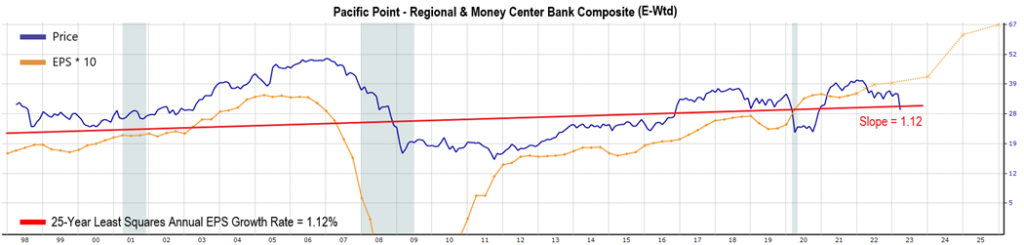
*Please see disclaimers 2, 3, and 4. Source: Zacks Research System
The Pacific Point Stable Earnings™ family of core equity portfolios are intentionally constructed to reduce economic cycle dynamics and are specifically managed for earnings stability and growth. Consolidated long-term earnings stability at the portfolio level is designed to reduce volatility and increase downside protection against loss of capital during economic recessions and unforeseen events.
The cornerstone of the Pacific Point family of funds is the Stable Earnings™ Core Portfolio. The following chart illustrates the Stable Earnings™ Core model portfolio has a 25-year model track record of high earnings growth and low earnings volatility. The 25-year annual EPS growth rate of 12.91% is represented by the slope of the least squares trend line. This earnings growth is approximately five times higher than the average rate of U.S. inflation and encompasses three prior recessions, including the U.S. economic shutdown caused by COVID-19 and the monetary normalization period of 2022/2023.
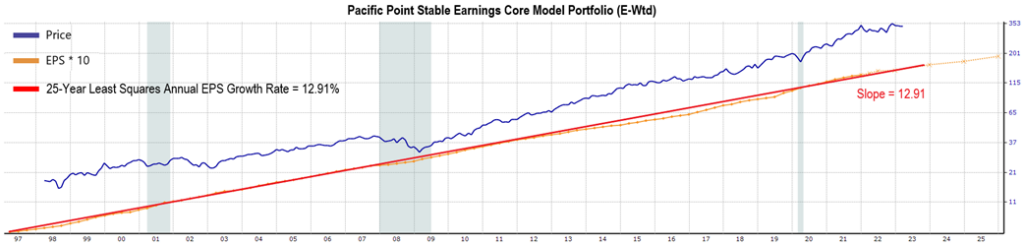
*Please see disclaimers 1, 2, 3, and 4. Source: Zacks Research System
Conclusion
The Stable Earnings™family of core equity portfolios are designed to be “sleep at night” portfolios for long-term investors looking to efficiently compound wealth. Because cyclical stocks are specifically excluded from the Stable Earnings™ portfolios, these portfolios give investors and their advisors the freedom to tactically “tilt” around their core equity allocation to add economic cycle exposure when appropriate.
The recent decline in bank and financial stocks illustrates the value of this approach. For example, suppose an investor believed the current banking crisis was behind us and wanted to add financial exposure to a portfolio. In that case, the investor could buy a bank ETF or individual bank stocks. If an investor felt the banking crisis was going to get worse, that investor could either do nothing or proactively short a bank stock ETF or individual bank stocks. Structured correctly, all these outcomes could be achieved without the need to sell the investor’s core Stable Earnings™ portfolio, thereby avoiding both taxes and trading costs.
If you want to learn more about using our Stable Earnings™ portfolios and how to construct customized portfolios, please contact Tim Nyland or Jay Winship for additional details.
Our Discipline, Your Strength
The Stable Earnings™ family of core equity portfolios is a well-defined discipline that’s been consistently applied over 25 years. In addition to long-term earnings stability and growth, we carefully select portfolio companies based on superior capital efficiency, profitability, and overall fundamental quality. The Stable Earnings™ family of “core” equity portfolios are available in three different strategies: Core, Dividend and ESG.
General Disclaimer
This report is not an offer to sell securities of any investment fund, a solicitation of offers to buy any such securities, or a solicitation to open a separately managed account with Pacific Point Advisors, LLC (“Pacific Point”).
An investment in any strategy, including the Pacific Point Stable Earnings™ Stock Portfolio strategy (the “PSE”) described herein, involves a high degree of risk. The PSE is not an actual index but represents the hypothetical performance of a concentrated basket of stocks picked by Pacific Point, with the benefit of hindsight. There is no guarantee that the investment objective will be achieved. Past performance of these strategies is not necessarily indicative of future results. There is the possibility of loss, and all investment involves risk including the loss of principal.
The information in this presentation was prepared by Pacific Point and is believed by Pacific Point to be reliable and has been obtained from public sources believed to be reliable. Pacific Point makes no representation as to the accuracy or completeness of such information. Opinions, estimates and projections in this presentation constitute the current judgment of Pacific Point and are subject to change without notice. Any projections, forecasts and estimates contained in this presentation are necessarily speculative in nature and are based upon certain assumptions. It can be expected that some or all of such assumptions will not materialize or will vary significantly from actual results. Accordingly, any projections are only estimates and actual results will differ and may vary substantially from the projections or estimates shown. This presentation is not intended as a recommendation to purchase or sell any commodity or security. Pacific Point has no obligation to update, modify or amend this presentation or to otherwise notify a reader thereof in the event that any matter stated herein, or any opinion, project on, forecast or estimate set forth herein, changes or subsequently becomes inaccurate.
This research report is strictly confidential and may not be reproduced or redistributed in whole or in part nor may its contents be disclosed to any other person without the express consent of the Pacific Point.
ALL STATEMENTS IN THIS PRESENTATION ARE THE OPINIONS OF PACIFIC POINT, UNLESS OTHERWISE SPECIFIED.
Additional Disclaimers
Disclaimer 1 – Investment Strategy
The description herein of the approach of Pacific Point and the targeted characteristics of the PSE™ strategy and investments is based on current expectations and should not be considered definitive or a guarantee that the approaches, strategies, and investment portfolio will, in fact, possess these characteristics. In addition, the description herein of the PSE’s risk management strategies is based on current expectations and should not be considered definitive or a guarantee that such strategies will reduce all risk. These descriptions are based on information available as of the date of preparation of this document, and the description may change over time. Past performance, model performance, and back testing of these strategies is not necessarily indicative of future results. There is the possibility of loss and all investment involves risk including the loss of principal.
Disclaimer 2 – Graphs and Charts
The graphs, charts and other visual aids are provided for informational purposes only. None of these graphs, charts or visual aids can and of themselves be used to make investment decisions. No representation is made that these will assist any person in making investment decisions and no graph, chart or other visual aid can capture all factors and variables required in making such decisions.
Disclaimer 3 – Forward Looking Statements/Projections
Any projections, forecasts, objectives and estimates contained in this document are necessarily speculative in nature and are based upon certain assumptions. In addition, matters they describe are subject to known (and unknown) risks, uncertainties and other unpredictable factors, many of which are beyond Pacific Point’s control. No representations or warranties are made as to the accuracy of such forward-looking statements. It can be expected that some or all of such forward-looking assumptions will not materialize or will vary significantly from actual results. Accordingly, any projections are only estimates and actual results will differ and may vary substantially from the projections or estimates shown. This presentation cannot and does not guarantee or predict a similar outcome with respect to any future investment.
Disclaimer 4 – Hypothetical Scenarios
Zacks Research System was used to create the Pacific Point – Regional and Money Center Bank Composite and the Pacific Point Stable Earnings Core Model Portfolio composite which represent hypothetical portfolios that assume 3/21/2023 membership applied to historical time series data for the periods presented. Hypothetical scenarios calculated by Zacks via Zacks Research System on 3/22/2023.