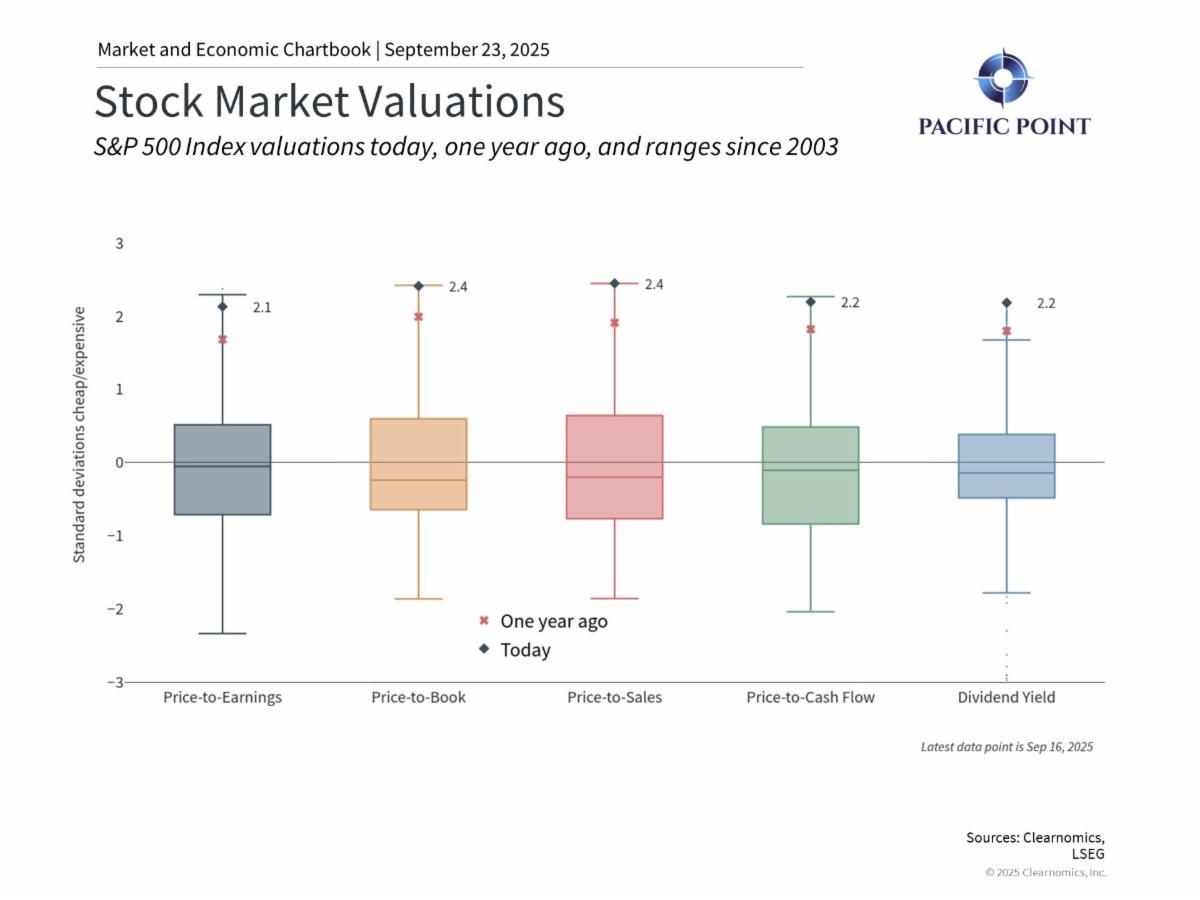
Historical Stock Market Valuations
- The S&P 500’s forward P/E is 22.4x (vs. 15.9x long-term average), above normal but below the tech bubble peak of 24.5x.
- The Shiller P/E of 38x also exceeds its historical average of 27x, pointing to elevated valuations.
- Large Cap Growth stocks trade at the highest P/E (28x) with 16.1% expected earnings growth, while Small Value stocks look cheaper at 13.6x with stronger 18.1% growth.
- Valuations vary by segment and are useful for context, but they don’t predict short-term market moves.
Overall, elevated valuations suggest more modest long-term returns, but the key to success is staying invested through cycles, not timing the market.


