
Major U.S. stock indices ended lower on Friday, June 10th following the U.S. Labor Department Consumer Price Index (CPI) inflation gauge reaching a new 40-year high in May. A second bad inflation report was released on Friday, June 10th when the University of Michigan survey of consumers’ long-term inflation expectations increased to the highest level since the Great Recession.
While inflation may be in the process of peaking, we feel it is far from under control and anticipate rising costs to materially erode U.S corporation profit margins starting with the Q2 2022 reporting season.
Commodity Prices – The Supply Side CPI and PPI Conundrum
The Covid era of 2020 brought varying degrees of lockdown responses from countries around the world, causing global supply chain bottlenecks and driving commodity prices to record highs. Supply chain constraints have been further exacerbated by the war in Ukraine and China’s zero Covid policy stance.
After a brief reprieve in commodity price pressures at the end of 2021, oil and other commodity prices have again surged because of disruptions caused by the worst European conflict since World War II. Surging commodity prices are being felt around the world and are threatening global recession as central banks are raising benchmark interest rates along with other forms of quantitative tightening to curtail demand and fight inflation.
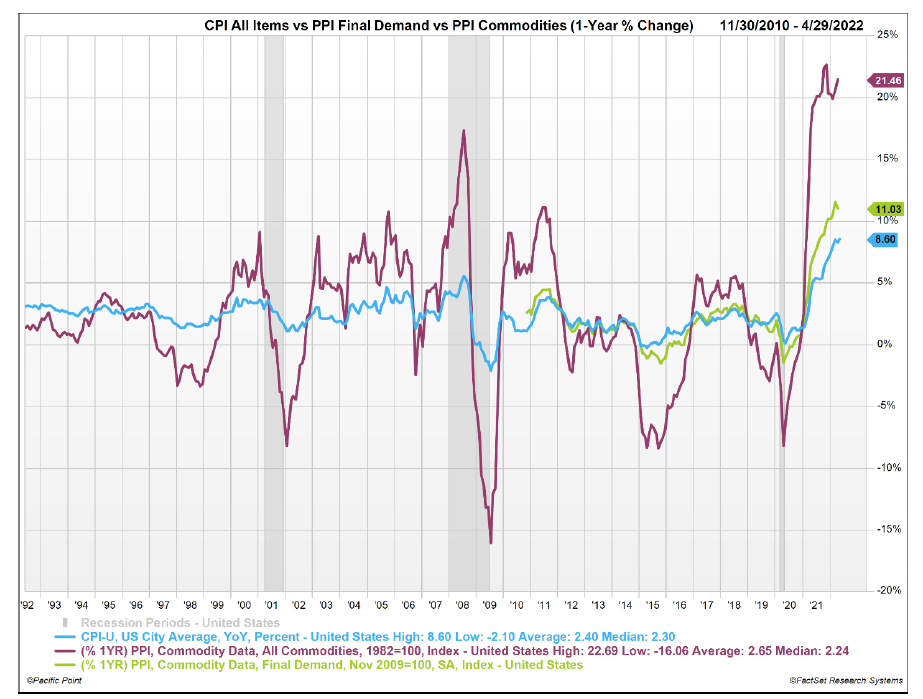
The chart below shows the 30-year history of the Producer Price Index, the Producer Price Commodity Index and the Consumer Price Index All Items. On June 10th, 2022, the U.S. Bureau of Labor Statistics reported May 2022, annual CPI increase of 8.6%. Important to note that the most recently reported April 2022 PPI increase of 11.0% occurred against the backdrop of a PPI Commodity Price Index increase of 21.5% from the year ago period.
The chart below illustrates the degree to which commodity prices drive annual changes in PPI and CPI. It is important to note that Federal Reserve monetary policy has limited influence on the supply side of inflation issues. Instead, the Federal Reserve is tasked with reducing demand commensurate with existing supply levels until the annual rate of inflation meets the Fed target of 2% all while maintaining full employment.
*Please see disclaimers 2 and 3 Source: FactSet
Rising CPI – Reducing Real Wage Gains and Threatening Corporate Profit Margins
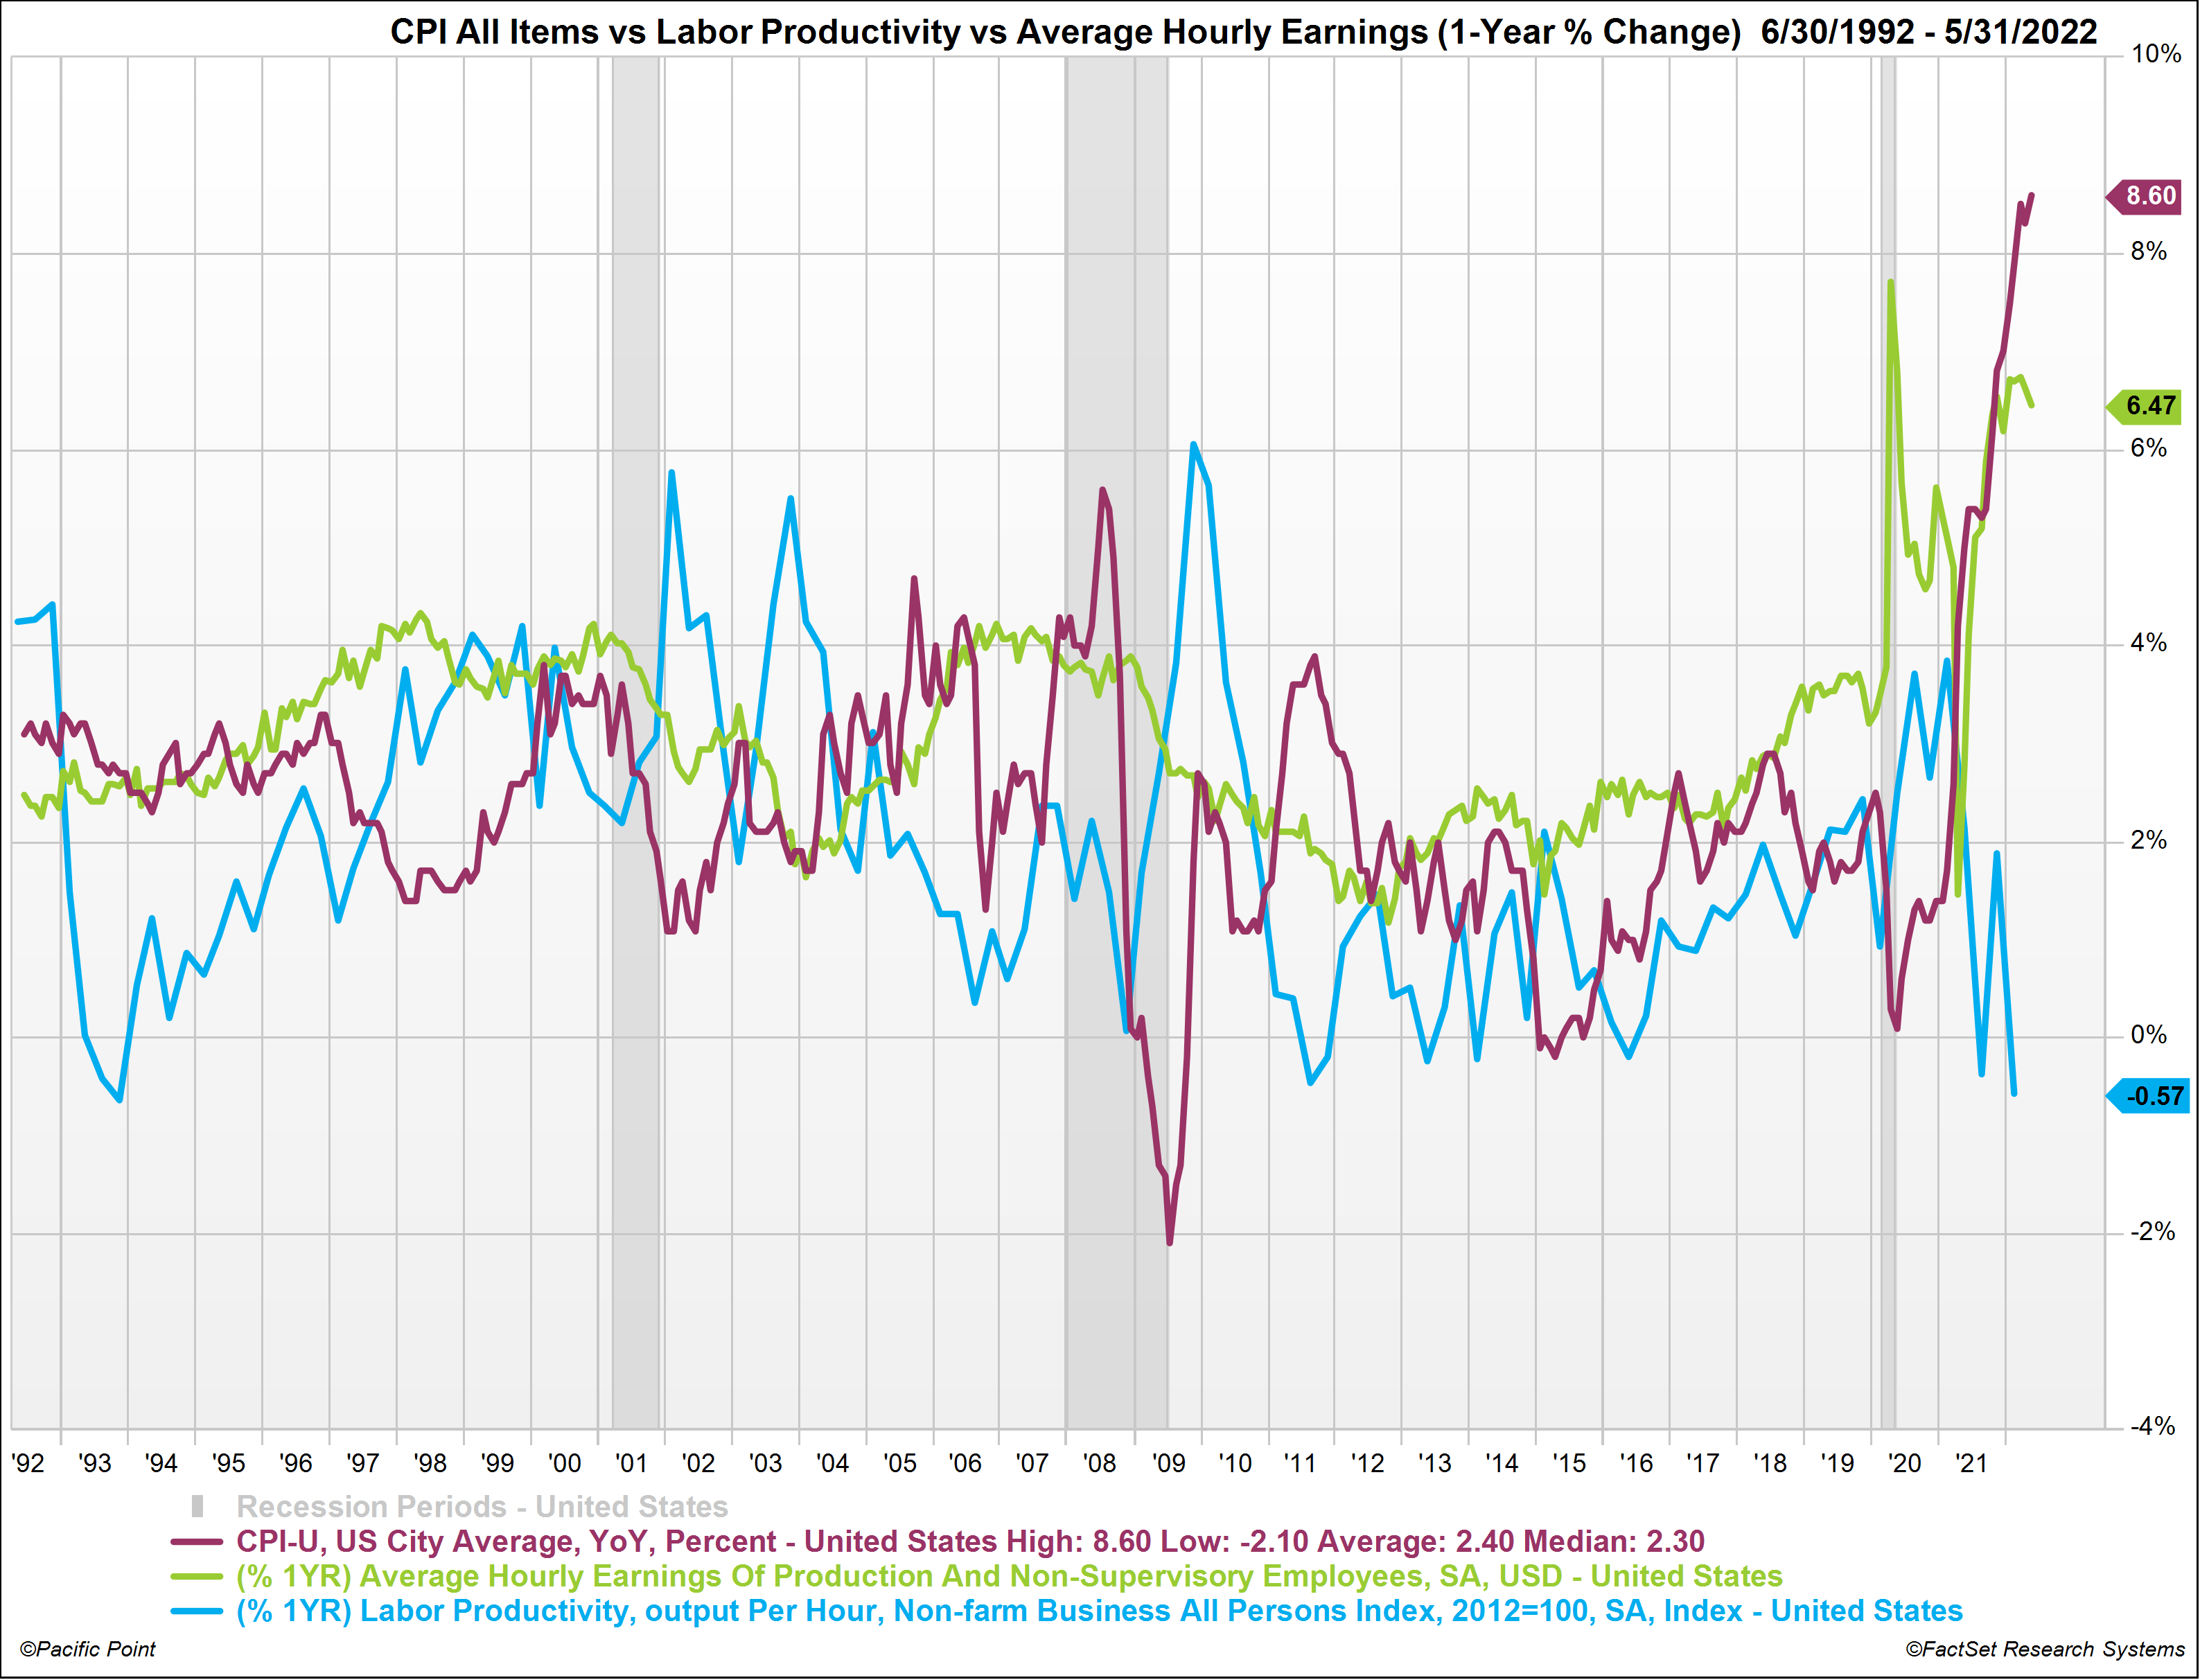
The chart below shows the 30-year history of Consumer Price Index All Items, Labor Productivity and Average Hourly Earnings. Starting in October of 2021, the annual rate of CPI increase began outpacing the increase in Average Hourly Earnings resulting in the reduction of real wage gains. For corporations, the Average Hourly Earnings inflation starting in 2021 came at the expense of Labor Productivity which notched near 30-year lows in April 2022. Increase in Average Hourly Earnings paired with a decline in Labor Productivity translates to corporations paying more per unit of declining labor output. Stated differently, this translates to higher labor costs and lower operating (EBIT) margins.
*Please see disclaimers 2 and 3 Source: FactSet
Decline in Real Wage Gains, Personal Savings Rates and Consumer Credit
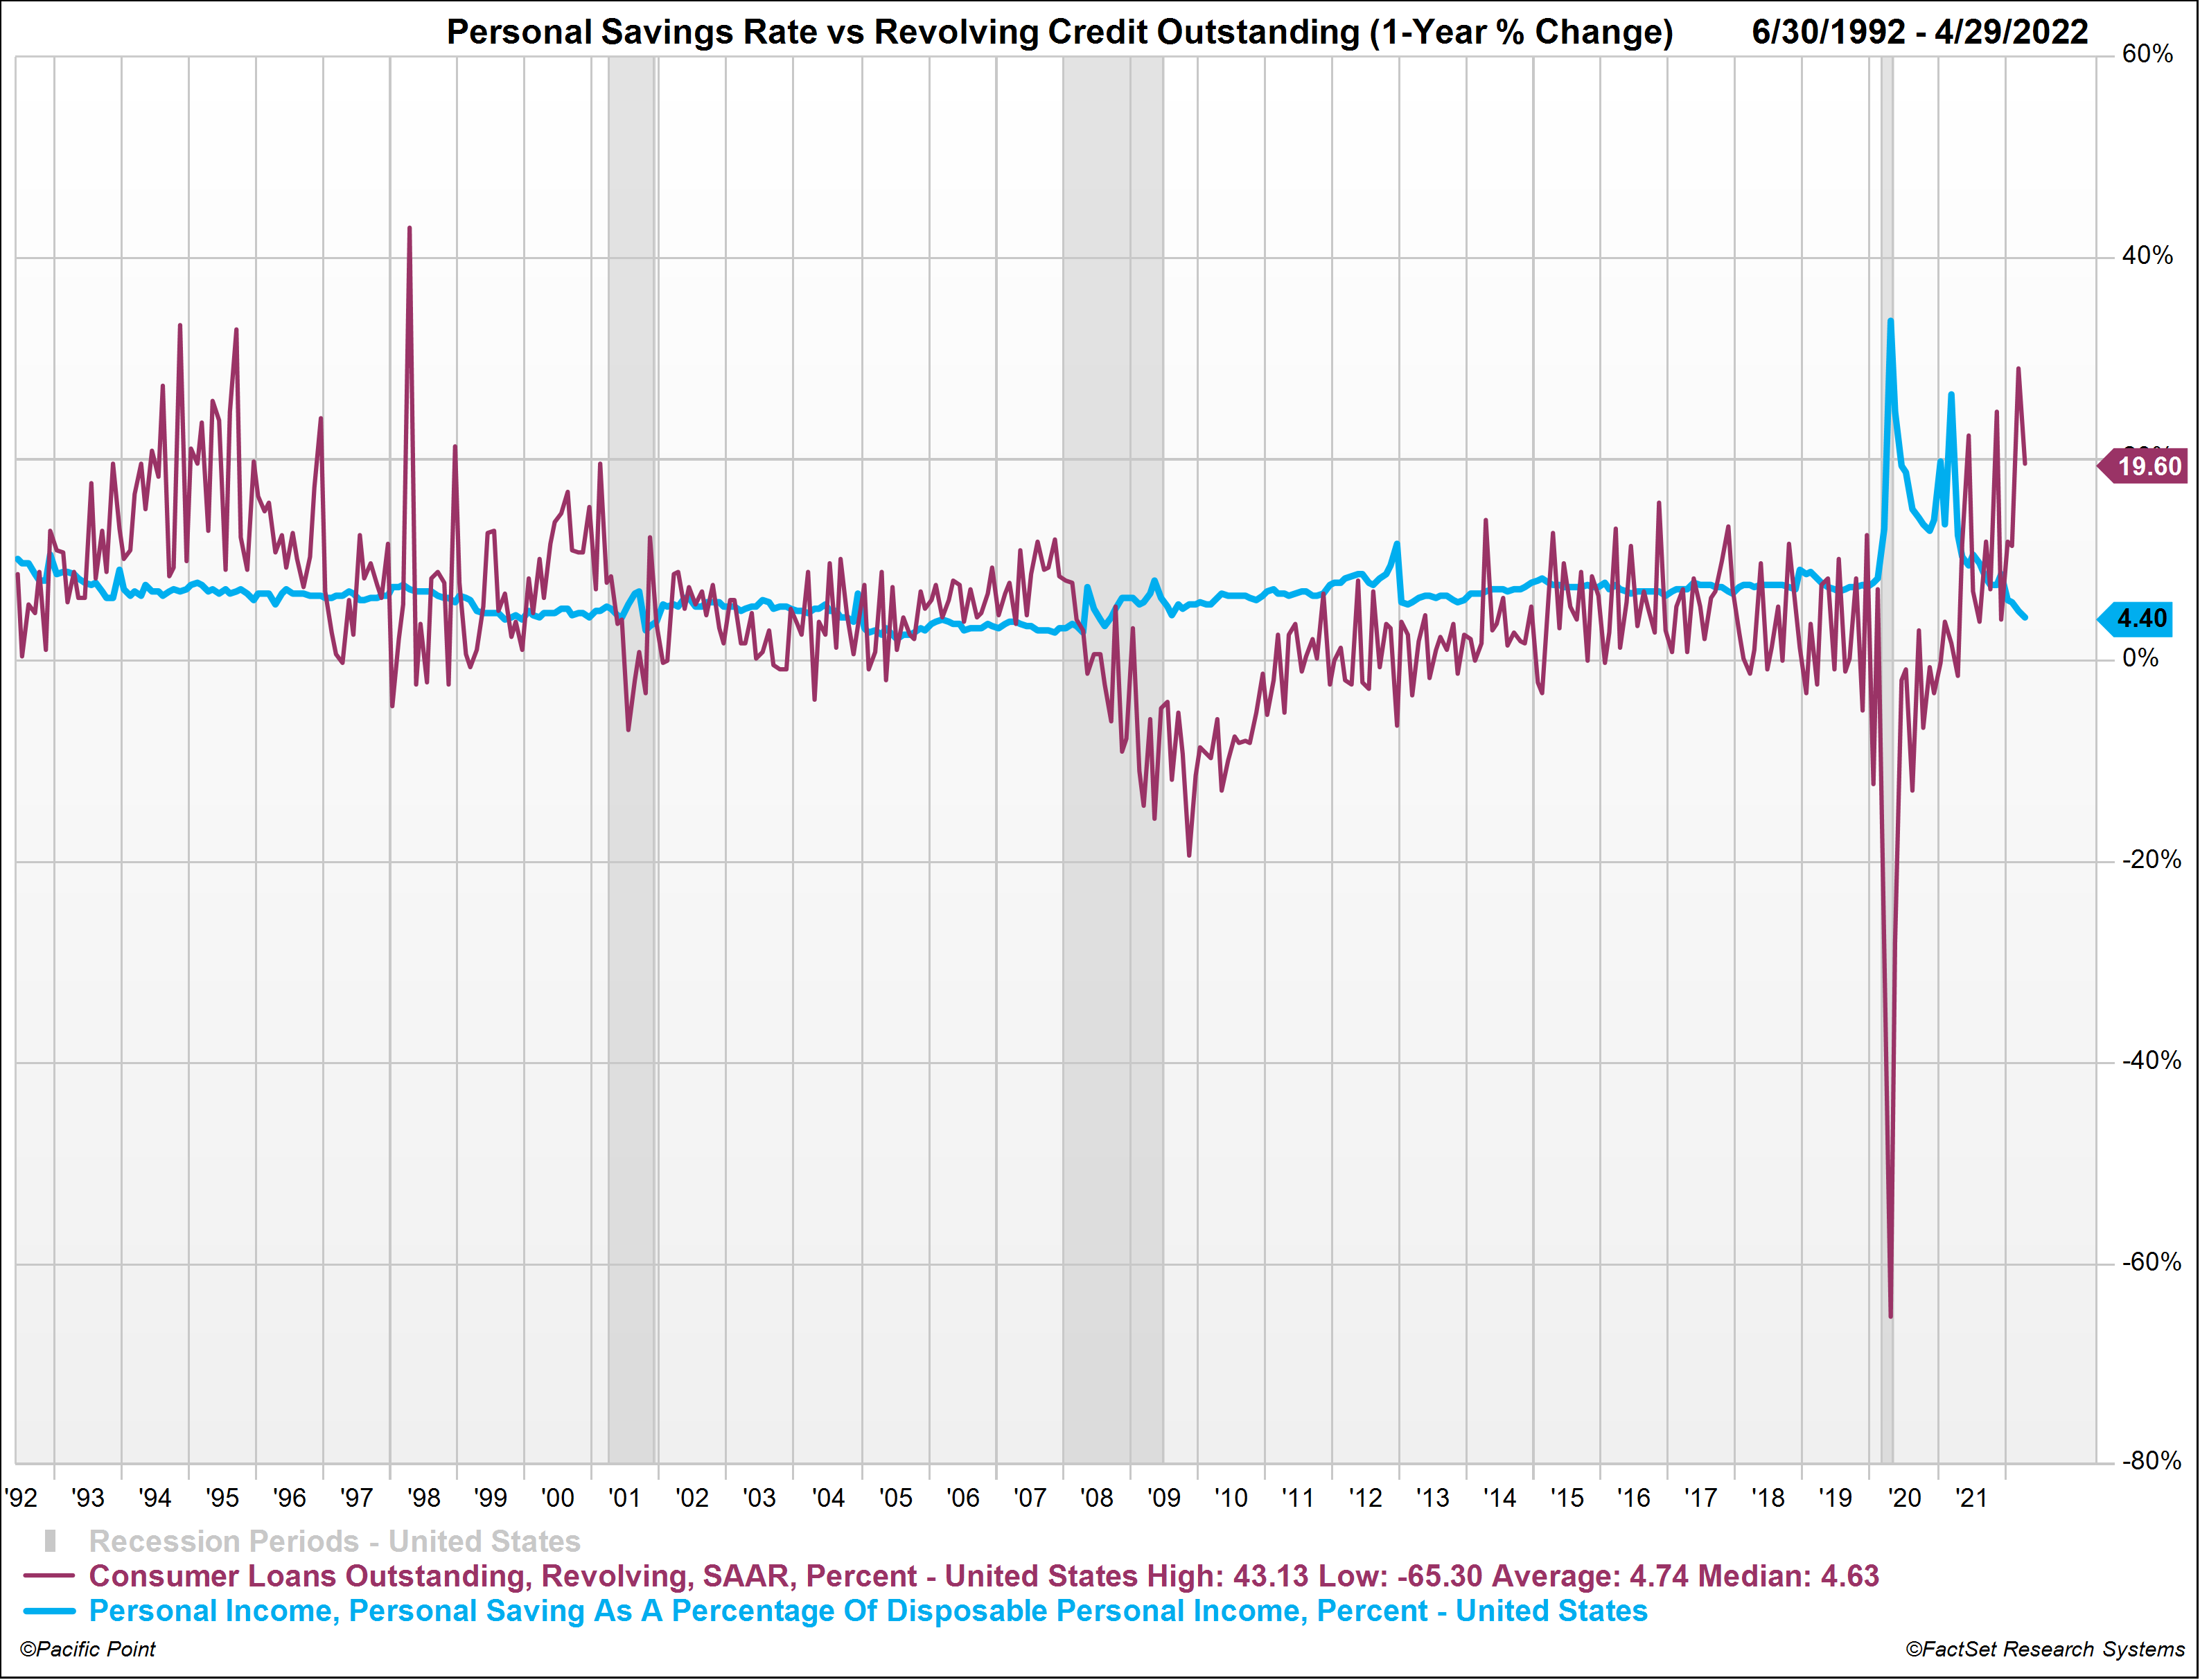
The chart below illustrates the 30-year history of annual change in the Personal Savings Rate versus the annual change in Consumer Revolving Credit Outstanding. The Personal Savings Rate has dipped to 4.4%, to levels not seen since the 2008-09 Financial Crisis, as annual wage gains have failed to keep up with annual change in CPI. The annual increase in Consumer Revolving Credit Outstanding of 19.6% is offsetting the decline in the Personal Savings Rate suggesting that many consumers are stretched and using savings and credit cards to make household purchases.
*Please see disclaimers 2 and 3 Source: FactSet
Quantitative Tightening Starting with Corporate Margins at Cyclical Peak Levels
On Wednesday June 1st, the Federal Reserve began reducing its ~$9 trillion portfolio to supplement rate hikes and reinforce the central bank’s fight against inflation. The Fed began reducing its holdings of Treasury securities, agency debt, and agency mortgage-backed securities by a combined $47.5 billion per month and will do this for three months. After this, the total amount to be reduced goes up to $95 billion a month, with policy makers prepared to adjust their approach as the economy and financial markets evolve. In short, the economy is anticipated to cool, and yields are likely to rise, both of which makes stocks less attractive at a time when corporate margins are at cyclical peak levels.
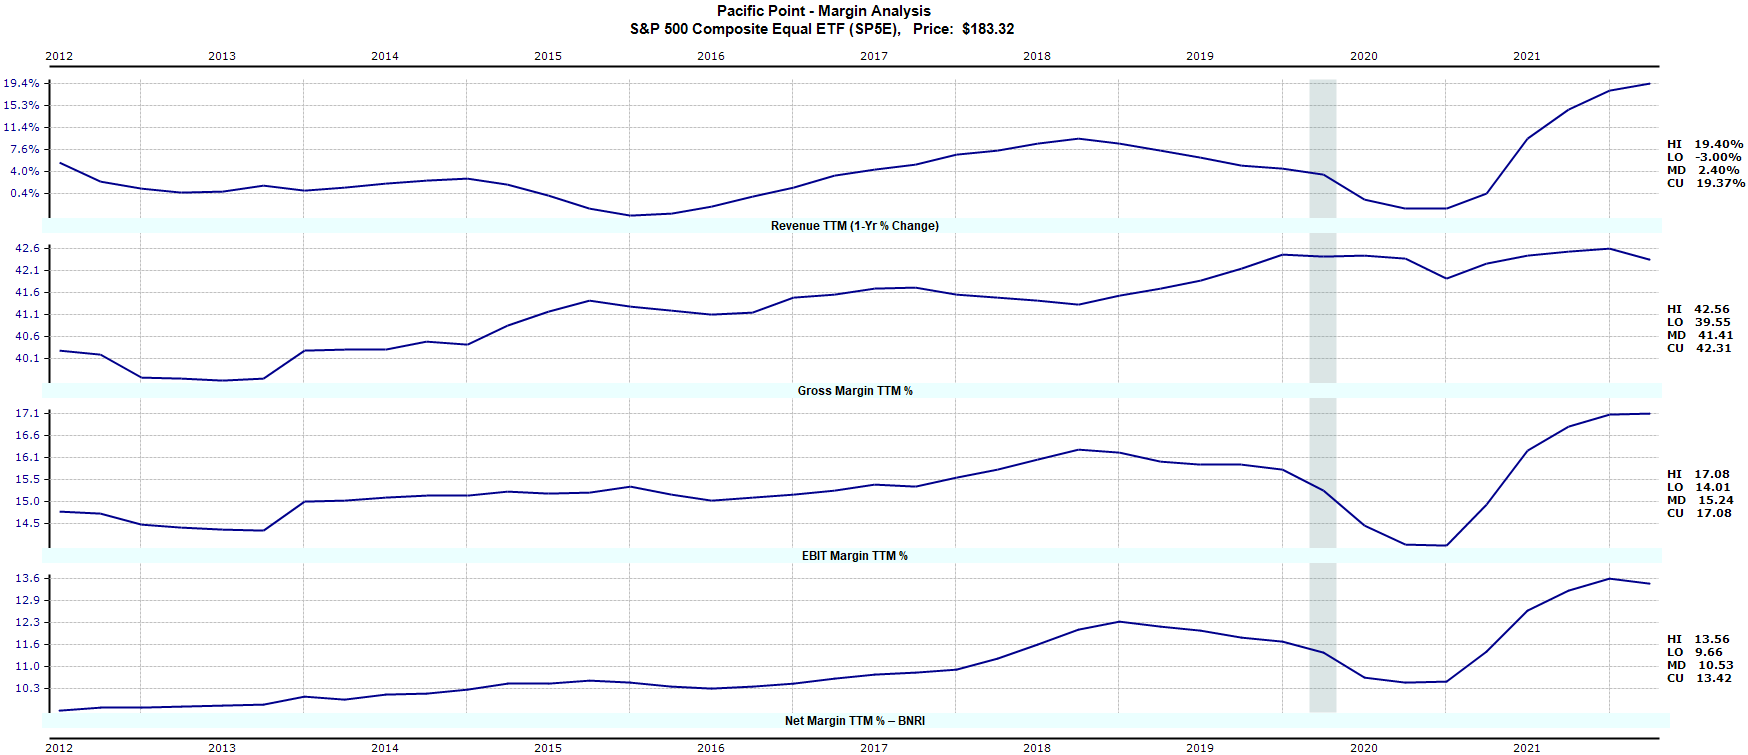
The chart below illustrates the 15-year history of profit margins for the equal weighted average S&P 500 composite with current points for the 1-year % change in Revenues, Gross Margin Operating (EBIT) Margin and Net Margin all sitting at 15-year cyclical peak levels. As the economy begins to cool, we anticipate the 1-year % change in Revenues to rollover starting in Q2 of 2022. As revenues growth begins to cool, we expect margins to begin declining at all levels of Gross, Operating and Net Margins. Analyst EPS estimates have yet to reflect the anticipated margin compression due to slower economic growth resulting from rising rates and quantitative tightening.
*Please see disclaimers 2 and 3 Source: FactSet
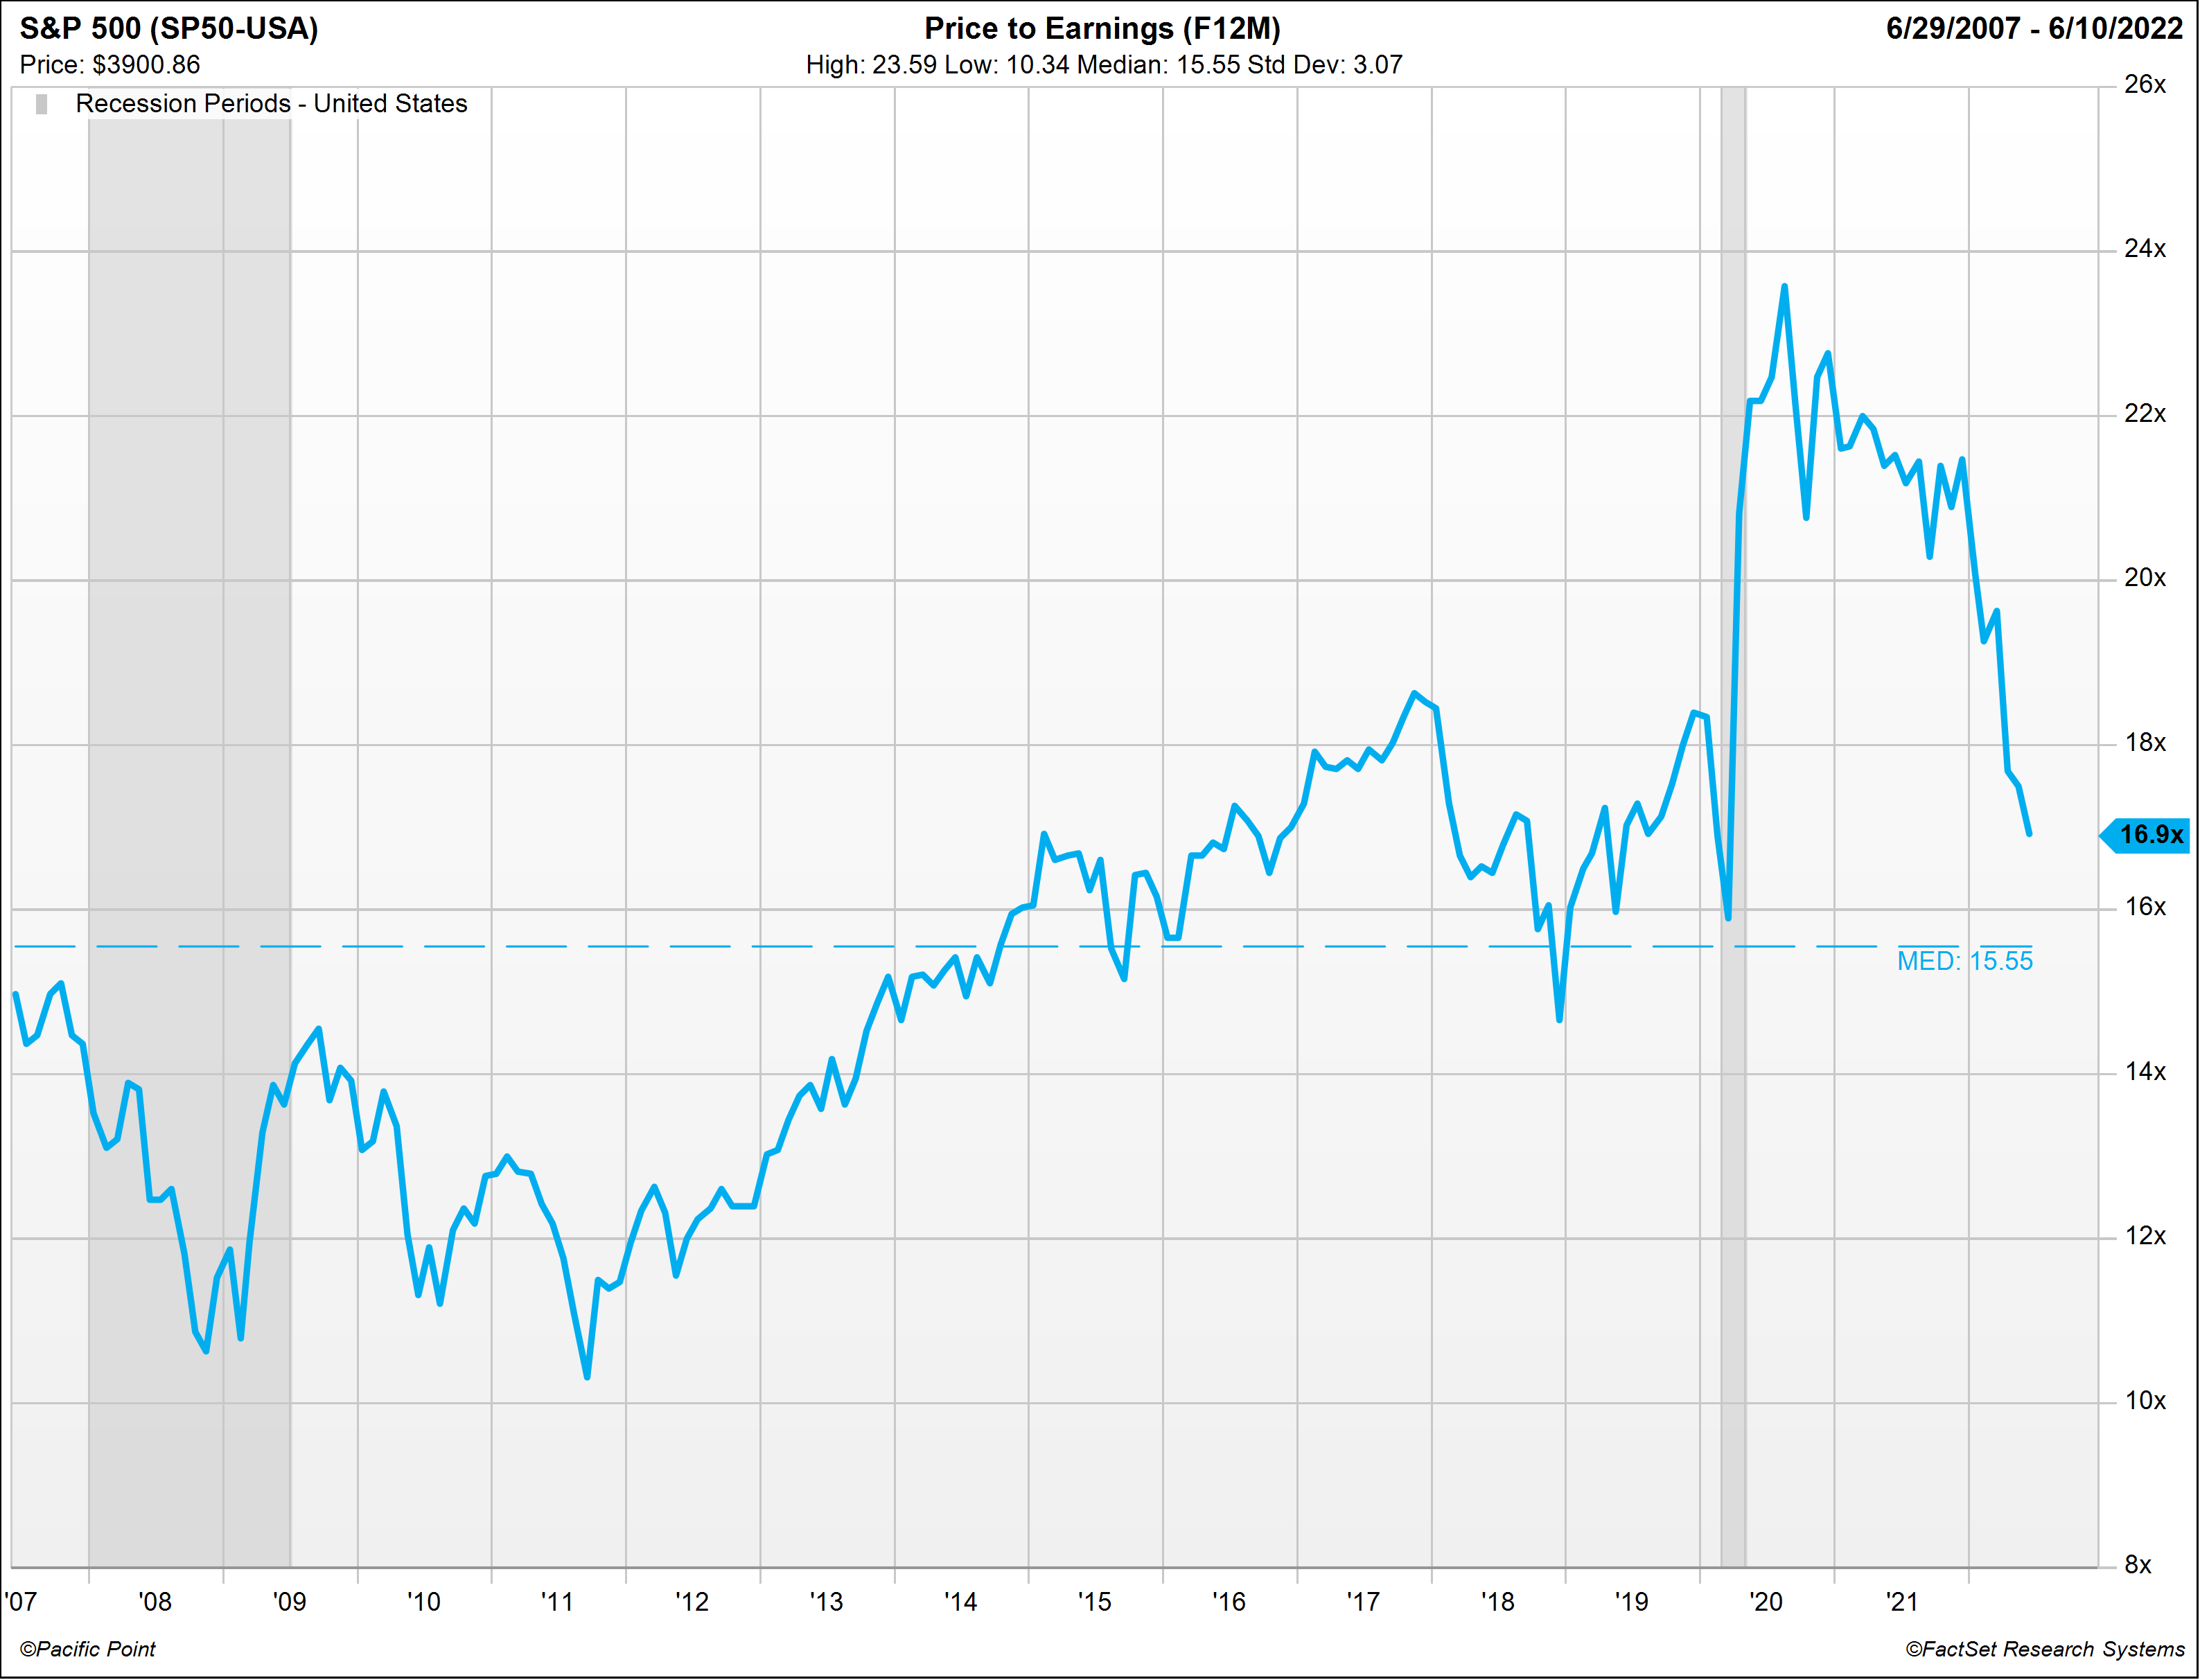
S&P 500 PE F12M Trading at Premium to 15-Year Median with Slowdown Looming
To date, the 2022 market selloff has come from PE multiple compression in anticipation of rising rates and quantitative tightening with little consideration for what we believe will be declining EPS estimate revisions resulting from a broad-based slowdown in U.S. economic growth. The S&P 500 price to forward EPS multiple has fallen from 20x at the start of 2022 to 16.9x on June 10th, 2022.
The chart below illustrates the S&P 500 price to forward EPS multiple of 16.9x remains elevated from its 15-year median trend of 15.5x and significantly elevated from forward earnings multiples of 14.5x experienced during the last Fed tightening cycle from 2017 to 2019.
Based on current, elevated levels of S&P 500 EPS F12M forecasts, a 14.5x price to earnings multiple represents a 14% S&P 500 decline to $3,346 from current the price of $3,900.
*Please see disclaimers 2 and 3 Source: FactSet
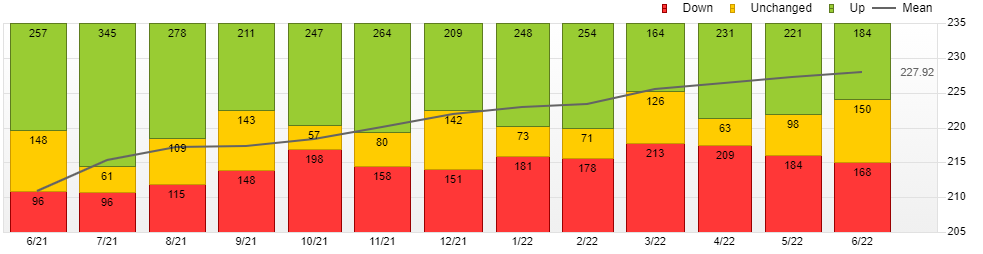
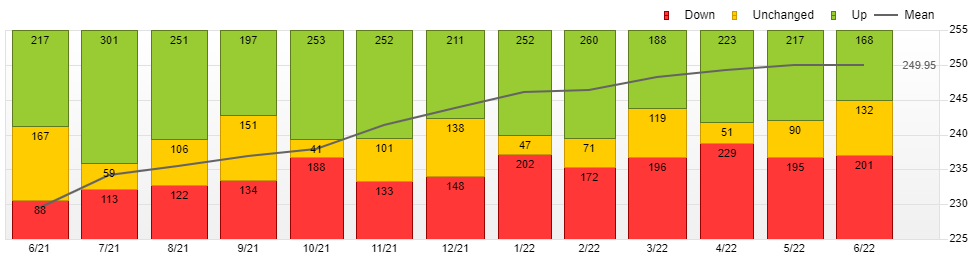
The charts below illustrate the 12-month history of S&P 500 FY1 and FY2 EPS estimate revision trends. Note that S&P 500 EPS estimates for both FY1 ($227.92) and FY2 ($249.95) remain at peak levels of revision. It is our belief that sell-side analysts, as a consensus, tend to be late revising estimates down into a recession and late revising estimates up out of a recession.
Stocks may appear to be approaching 15-year median PE F12M levels, but valuations are being derived on EPS estimates that may be subject to downward revision given the current macroeconomic backdrop. The average recession sees corporate profit margins decline more than 20% from peak levels. How much additional risk to the downside is there if EPS forecasts are revised down from current levels?
S&P 500 (SP50) FY1 EPS Estimate Revision Trend – December 2022
*Please see disclaimers 2 and 3 Source: FactSet
S&P 500 (SP50) FY2 EPS Estimate Revision Trend – December 2023
*Please see disclaimers 2 and 3 Source: FactSet
With all the Macroeconomic Uncertainties – Are you Still Trying to Time the Market?
Media Influence and The Fear of Missing Out is the trap that most advisors and investors alike fall prey to as they feel pressured to chase market trends and performance. Media outlets bombard advisors and investors each day with a small number of ‘experts’ who appear to have made all the right moves while most are left holding yesterday’s trade. This is where a disciplined, all-weather approach can pay off in the long run as most investors and advisors cannot consistently time market cycles over the long term regardless of what the media wants you to believe!
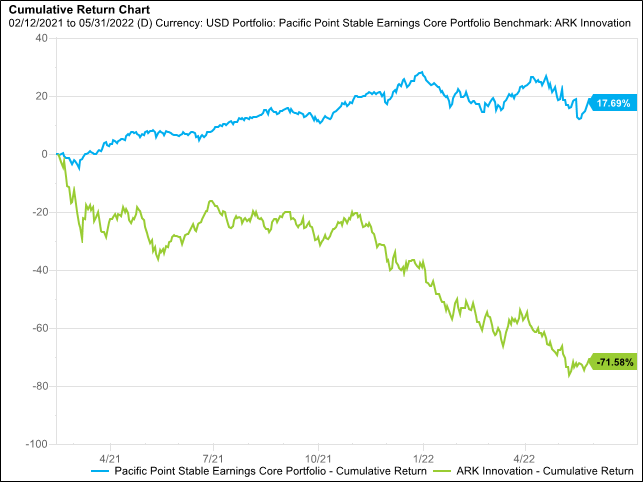
Did you and your clients miss the Covid stimulus induced Ark Innovation ETF (ARKK) rally of 2020/2021? Consider the following performance since ARKK inception through May 31, 2022. Would you rather have the volatility of the ARK Innovation ETF with a drawdown of 71.58% from all-time highs reached on 2/12/2021? Or the long-term performance of a well-disciplined strategy like the Pacific Point Stable EarningsTM Core Portfolio with a gain of 17.69% over the same timeframe? With Stable EarningsTM Core cumulative return from 10/31/2014 to 5/31/2022 outperforming the ARK Innovation ETF by a steady 20.36%, which strategy would allow you and your clients to sleep better at night?
*Cumulative Total Return from ARKK Inception 10/31/2014 through 5/31/2022
Pacific Point Stable EarningsTM Core Model Portfolio = 168.36% vs. ARK Innovation ETF = 148.00%:
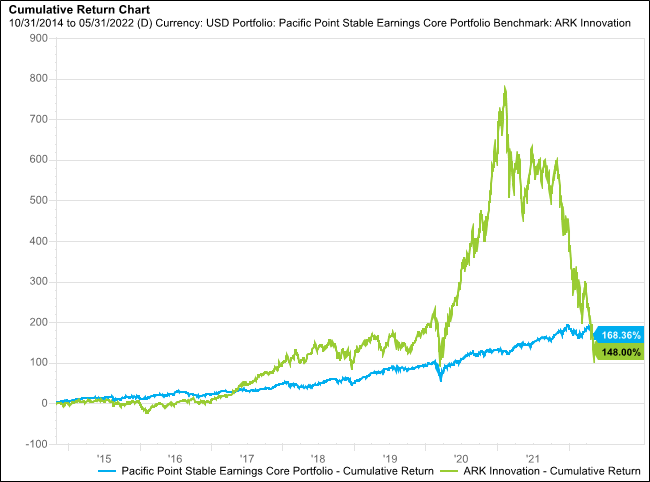
*Hypothetical Model Returns as of 10/31/2014. Net return of .5% advisory fee. See disclaimers 1, 2, 3, 4, 5, and 6 Source: FactSet
*Cumulative Total Return from ARKK Peak on 2/12/2021 through 5/31/2022
Pacific Point Stable EarningsTM Core Model Model Portfolio = 17.69% vs. ARK Innovation ETF = -71.58%
*Hypothetical Model Returns as of 10/31/2014. Net return of .5% advisory fee. See disclaimers 1, 2, 3, 4, 5, and 6 Source: FactSet
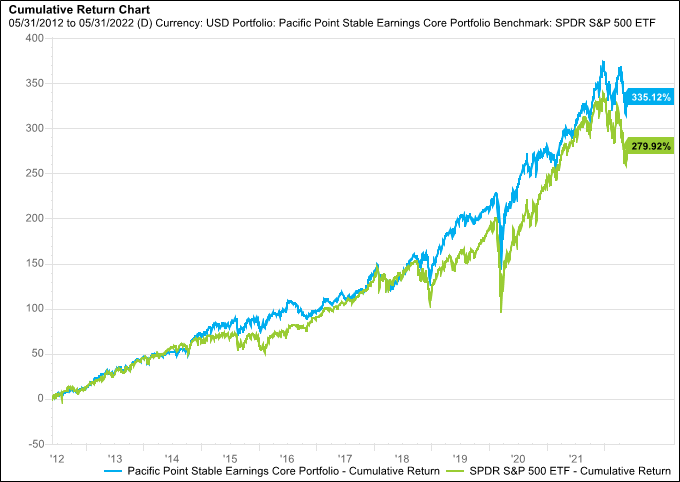
The cornerstone of the Pacific Point family of funds is the Stable EarningsTM family of core equity portfolios. The Stable EarningsTM family represents concentrated, carefully selected stock portfolios whose consolidated earnings have been stable over a long period of time, 25+ years. Consolidated earnings stability at the portfolio level may provide downside protection against loss of capital during periods of economic recession and unforeseen, black swan events.
*10-Year Cumulative Total Return 5/31/2012 – 5/31/2022
Pacific Point Stable EarningsTM Core Model Portfolio = 335.12%
SPDR S&P 500 ETF Trust = 279.92%
*Hypothetical Model Returns as of 10/31/2014. Net return of .5% advisory fee. See disclaimers 1, 2, 3, 4, 5, and 6 Source: FactSet
Our Discipline, Your Strength
All Stable EarningsTM portfolio companies have a demonstrated 25-year history of capital efficiency, profitability, and overall fundamental quality. Management of the Stable EarningsTM family of equity portfolios is a well-defined discipline that seeks consistent application of the strategy through economic cycles.
General Disclaimer
This report is not an offer to sell securities of any investment fund, a solicitation of offers to buy any such securities, or a solicitation to open a separately managed account with Pacific Point Advisors, LLC (“Pacific Point”).
An investment in any strategy, including the Pacific Point Stable Earnings™ Stock Portfolio strategy (the “PSE”) described herein, involves a high degree of risk. The PSE is not an actual index but represents the hypothetical performance of a concentrated basket of stocks picked by Pacific Point, with the benefit of hindsight. There is no guarantee that the investment objective will be achieved. Past performance of these strategies is not necessarily indicative of future results. There is the possibility of loss, and all investment involves risk including the loss of principal.
The information in this presentation was prepared by Pacific Point and is believed by Pacific Point to be reliable and has been obtained from public sources believed to be reliable. Pacific Point makes no representation as to the accuracy or completeness of such information. Opinions, estimates and projections in this presentation constitute the current judgment of Pacific Point and are subject to change without notice. Any projections, forecasts and estimates contained in this presentation are necessarily speculative in nature and are based upon certain assumptions. It can be expected that some or all of such assumptions will not materialize or will vary significantly from actual results. Accordingly, any projections are only estimates and actual results will differ and may vary substantially from the projections or estimates shown. This presentation is not intended as a recommendation to purchase or sell any commodity or security. Pacific Point has no obligation to update, modify or amend this presentation or to otherwise notify a reader thereof in the event that any matter stated herein, or any opinion, project on, forecast or estimate set forth herein, changes or subsequently becomes inaccurate.
This research report is strictly confidential and may not be reproduced or redistributed in whole or in part nor may its contents be disclosed to any other person without the express consent of the Pacific Point.
ALL STATEMENTS IN THIS PRESENTATION ARE THE OPINIONS OF PACIFIC POINT, UNLESS OTHERWISE SPECIFIED.
Additional Disclaimers
Disclaimer 1 – Investment Strategy
The description herein of the approach of Pacific Point and the targeted characteristics of the PSE™ strategy and investments is based on current expectations and should not be considered definitive or a guarantee that the approaches, strategies, and investment portfolio will, in fact, possess these characteristics. In addition, the description herein of the PSE’s risk management strategies is based on current expectations and should not be considered definitive or a guarantee that such strategies will reduce all risk. These descriptions are based on information available as of the date of preparation of this document, and the description may change over time. Past performance, model performance, and back testing of these strategies is not necessarily indicative of future results. There is the possibility of loss and all investment involves risk including the loss of principal.
Disclaimer 2 – Graphs and Charts
The graphs, charts and other visual aids are provided for informational purposes only. None of these graphs, charts or visual aids can and of themselves be used to make investment decisions. No representation is made that these will assist any person in making investment decisions and no graph, chart or other visual aid can capture all factors and variables required in making such decisions.
Disclaimer 3 – Indices
References to market or composite indices, benchmarks, or other measures of relative market performance over a specified period of time may be presented to show general trends in the markets for the applicable period and are not intended to imply that the PSE is benchmarked to any indices either in composition or level of risk. Benchmark data is provided for comparative purposes only. Reference or comparison to an index does not imply that the portfolio will be constructed in the same way as an index or achieve returns, volatility, or other results similar to the index.
Indices are unmanaged, include the reinvestment of dividends and do not reflect transaction costs or any performance fees. Unlike indices, the PSE will be actively managed and may include substantially fewer and different securities than those comprising each index. Results for the PSE as compared to the performance of the Standard & Poor’s 500 Index (the “S&P 500”) is for informational purposes only. The S&P 500 is an unmanaged market capitalization-weighted index of 500 common stocks chosen for market size, liquidity, and industry group representation to represent U.S. equity performance. The PSE does not mirror this index and the volatility may be materially different than the volatility of the S&P 500.
Results for the PSE as compared to the performance of the Standard & Poor’s 500 Index (the “S&P 500”), is for informational purposes only. The S&P 500 is an unmanaged market capitalization-weighted index of 500 common stocks chosen for market size, liquidity, and industry group representation to represent U.S. equity performance. The PSE does not mirror this index and the volatility may be materially different than the volatility of the S&P 500.
Results for the PSE as compared to the performance of the Ark innovation ETF (ARKK) is for informational purposes only. The Ark innovation ETF is an actively managed fund that seeks long-term capital growth from companies globally involved with, or that benefit from, disruptive innovation. The PSE does not mirror this index and the volatility may be materially different than the volatility of the Ark innovation ETF.
Direct comparisons between the PSE’s performance and equity market indices are not without complications. The PSE’s portfolio may contain options and other derivative securities, fixed income investments, may include short sales of securities and margin trading and may not be as diversified as market indices. The indices may be unmanaged, may be market weighted, and unlike PSE, indices do not incur fees and expenses. Due to the differences among PSE’s portfolio and the performance of equity market indices, no such index is directly comparable to the PSE investment strategy.
Disclaimer 4 – Forward Looking Statements/Projections
Any projections, forecasts, objectives and estimates contained in this document are necessarily speculative in nature and are based upon certain assumptions. In addition, matters they describe are subject to known (and unknown) risks, uncertainties and other unpredictable factors, many of which are beyond Pacific Point’s control. No representations or warranties are made as to the accuracy of such forward-looking statements. It can be expected that some or all of such forward-looking assumptions will not materialize or will vary significantly from actual results. Accordingly, any projections are only estimates and actual results will differ and may vary substantially from the projections or estimates shown. This presentation cannot and does not guarantee or predict a similar outcome with respect to any future investment.
Disclaimer 5 – Model Returns/Back Testing
Model performance results are unaudited and do not reflect actual results of the PSE™ managed by Pacific Point. Model performance results are for illustrative purposes only and are not necessarily indicative of performance that would have been actually achieved if an investment utilized the strategy during the relevant periods, nor are these simulations necessarily indicative of future performance of the strategy. These model performance results are net of .5% advisory fees. Model returns are inclusive of the reinvestment of dividends and other earnings, including income from new issues. The model returns are based on the indicated time periods and do not give effect to high water marks, if any. Inherent limitations of model performance may include: 1) model results are generally prepared with the benefit of hindsight; 2) model results do not represent the impact that material economic and market factors might have on an investment adviser’s decision-making process if the adviser were actually managing client money; 3) there are numerous factors related to the markets in general, many of which cannot be fully accounted for in the preparation of hypothetical performance results and all of which may adversely affect actual investment results.
Disclaimer 6 – Specific Securities Shown
The companies and/or securities shown on the above presentation are presented for illustrative purposes only and are not necessarily actual securities held in PSE, nor is this list of companies necessarily indicative of potential or future holdings of PSE. Inclusion of such companies is not intended as a recommendation to purchase or sell any security. These companies are solely illustrative of Pacific Point’s investment strategy and are subject to change. Pacific Point may at any time adjust, increase, decrease or eliminate any of the target companies, depending on, among other things, market conditions and trends, general economic conditions and changes in Pacific Point’s investment philosophy, strategy and expectations regarding the focus, techniques, and activities of its strategy.