
Stable Earnings™ Portfolios - Year-to-Date Total Return Spotlight: 60/40 Asset Allocation Return Profile from a Stable EarningsTM Equity Portfolio?
Year-to-date 2022, against the backdrop of surging inflation, bonds measured by the Bloomberg U.S. Aggregate Bond Index, have fallen -11.47%. Long Term U.S. Treasuries, measured by the S&P 30-Year U.S. Treasuries Bond Futures Index, have fallen -15.82% over the same period. Both are among the worst bond returns in U.S. history.
The cornerstone of the Pacific Point family of funds is the Stable EarningsTM family of core equity portfolios. Stable EarningsTM core equity portfolios can serve as a proxy for a 60/40 asset allocation risk/return profile with no exposure to bonds.
The current market environment stresses the importance of earnings stability at the equity
portfolio level as this can provide risk profile enhancement necessary for protection against loss of capital during periods of market turbulence, rising yields, economic recession, and
unforeseen events. The current market volatility in a rising interest rate environment presents the ideal opportunity to showcase the total return of the Stable EarningsTM strategy relative to a traditional 60/40 asset allocation model and the S&P 500.
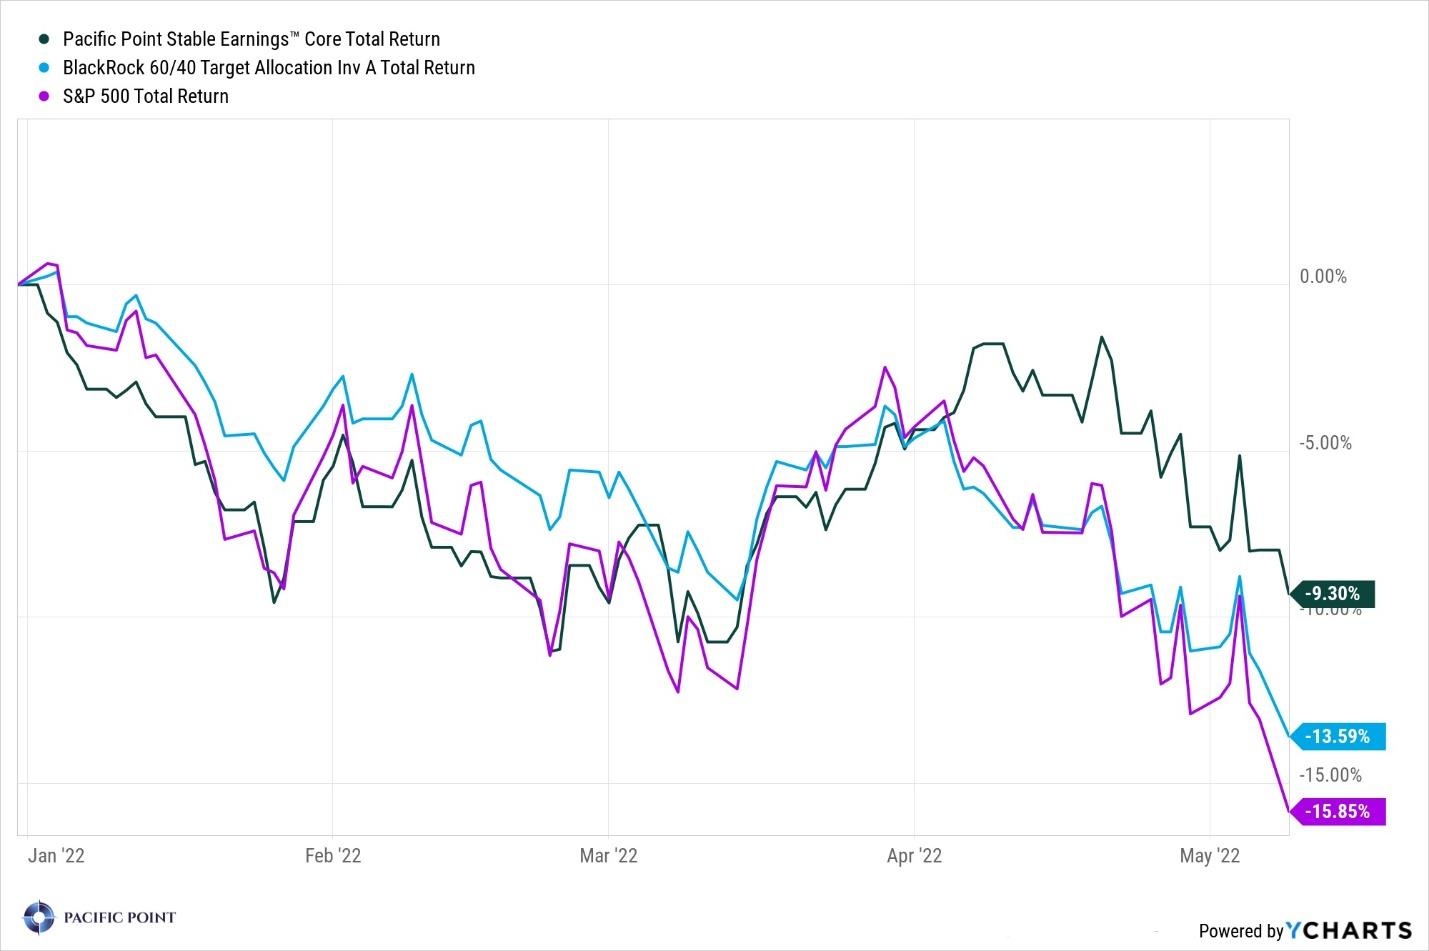
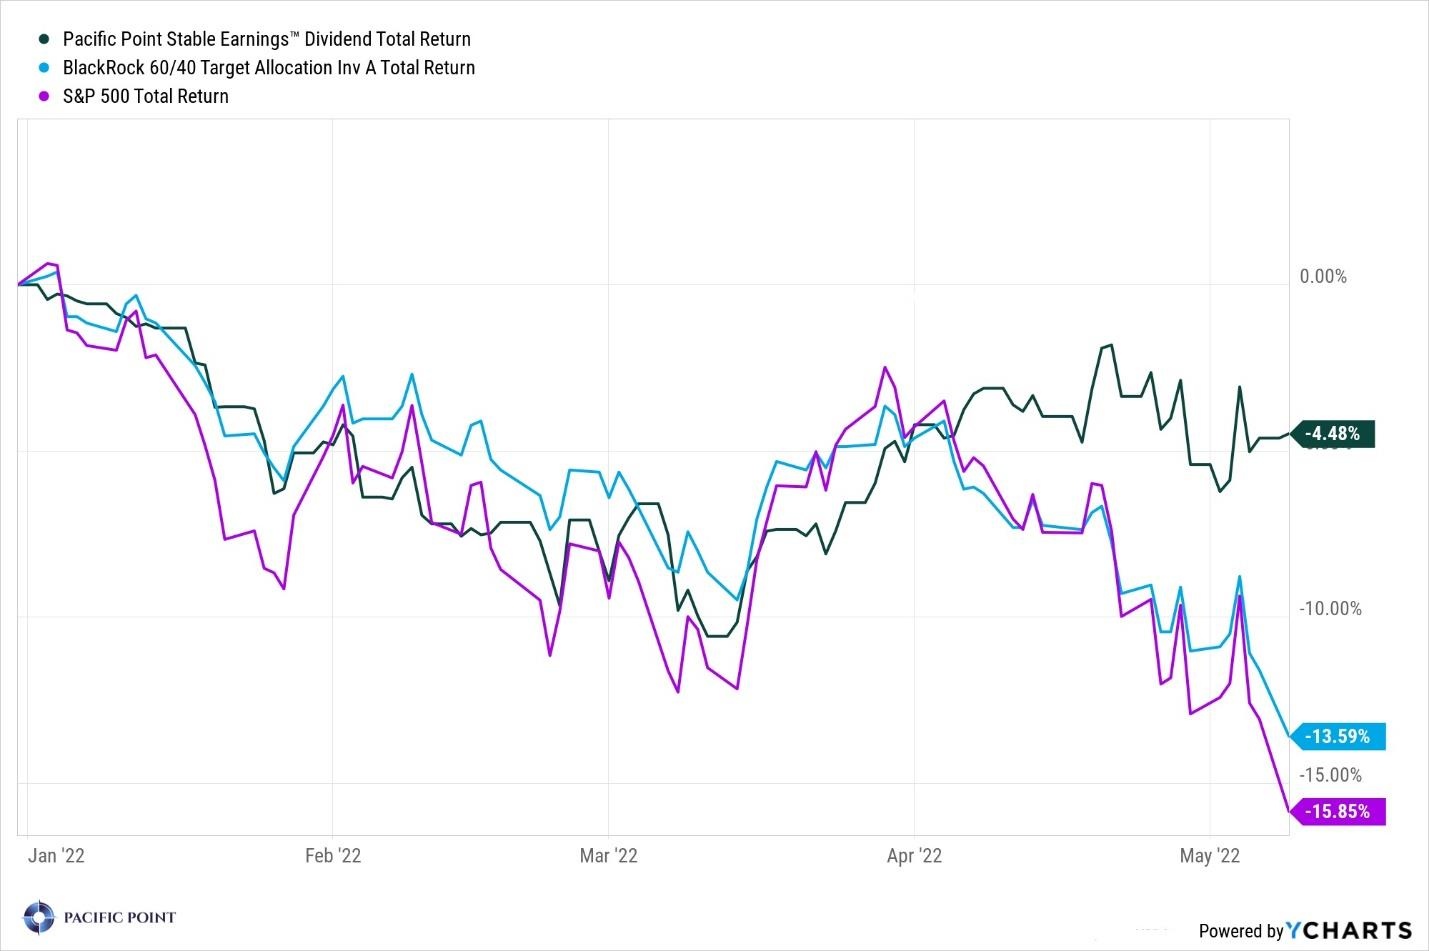
The charts below illustrate the Stable EarningsTM Core and Dividend portfolios, year-to-date total return relative to a traditional 60/40 asset allocation model and the S&P 500.
Stable EarningsTM Core vs. Traditional 60/40 Asset Allocation Model and S&P 500
Model Performance Returns
Stable EarningsTM Dividend vs. Traditional 60/40 Asset Allocation Model and S&P 500
Model Performance Returns
General Disclaimer
This report is not an offer to sell securities of any investment fund, a solicitation of offers to buy any such securities, or a solicitation to open a separately managed account with Pacific Point Advisors, LLC (“Pacific Point”).
An investment in any strategy, including the Pacific Point Stable Earnings™ Stock Portfolio strategy (the “PSE”) described herein, involves a high degree of risk. The PSE is not an actual index but represents the hypothetical performance of a concentrated basket of stocks picked by Pacific Point, with the benefit of hindsight. There is no guarantee that the investment objective will be achieved. Past performance of these strategies is not necessarily indicative of future results. There is the possibility of loss, and all investment involves risk including the loss of principal.
The information in this presentation was prepared by Pacific Point and is believed by Pacific Point to be reliable and has been obtained from public sources believed to be reliable. Pacific Point makes no representation as to the accuracy or completeness of such information. Opinions, estimates and projections in this presentation constitute the current judgment of Pacific Point and are subject to change without notice. Any projections, forecasts and estimates contained in this presentation are necessarily speculative in nature and are based upon certain assumptions. It can be expected that some or all of such assumptions will not materialize or will vary significantly from actual results. Accordingly, any projections are only estimates and actual results will differ and may vary substantially from the projections or estimates shown. This presentation is not intended as a recommendation to purchase or sell any commodity or security. Pacific Point has no obligation to update, modify or amend this presentation or to otherwise notify a reader thereof in the event that any matter stated herein, or any opinion, project on, forecast or estimate set forth herein, changes or subsequently becomes inaccurate.
This research report is strictly confidential and may not be reproduced or redistributed in whole or in part nor may its contents be disclosed to any other person without the express consent of the Pacific Point.
ALL STATEMENTS IN THIS PRESENTATION ARE THE OPINIONS OF PACIFIC POINT, UNLESS OTHERWISE SPECIFIED.
Additional Disclaimers
Disclaimer 1: Investment Strategy
The description herein of the approach of Pacific Point and the targeted characteristics of the PSE™ strategy and investments is based on current expectations and should not be considered definitive or a guarantee that the approaches, strategies, and investment portfolio will, in fact, possess these characteristics. In addition, the description herein of the PSE’s risk management strategies is based on current expectations and should not be considered definitive or a guarantee that such strategies will reduce all risk. These descriptions are based on information available as of the date of preparation of this document, and the description may change over time. Past performance, model performance, and back testing of these strategies is not necessarily indicative of future results. There is the possibility of loss and all investment involves risk including the loss of principal.
Disclaimer 2: Graphs and Charts
The graphs, charts and other visual aids are provided for informational purposes only. None of these graphs, charts or visual aids can and of themselves be used to make investment decisions. No representation is made that these will assist any person in making investment decisions and no graph, chart or other visual aid can capture all factors and variables required in making such decisions.
Disclaimer 3: Indices
References to market or composite indices, benchmarks, or other measures of relative market performance over a specified period of time may be presented to show general trends in the markets for the applicable period and are not intended to imply that the PSE is benchmarked to any indices either in composition or level of risk. Benchmark data is provided for comparative purposes only. Reference or comparison to an index does not imply that the portfolio will be constructed in the same way as an index or achieve returns, volatility, or other results similar to the index.
Indices are unmanaged, include the reinvestment of dividends and do not reflect transaction costs or any performance fees. Unlike indices, the PSE will be actively managed and may include substantially fewer and different securities than those comprising each index. Results for the PSE as compared to the performance of the Standard & Poor’s 500 Index (the “S&P 500”) is for informational purposes only. The S&P 500 is an unmanaged market capitalization-weighted index of 500 common stocks chosen for market size, liquidity, and industry group representation to represent U.S. equity performance. The PSE does not mirror this index and the volatility may be materially different than the volatility of the S&P 500.
Results for the PSE as compared to the performance of the Standard & Poor’s 500 Index (the “S&P 500”), is for informational purposes only. The S&P 500 is an unmanaged market capitalization-weighted index of 500 common stocks chosen for market size, liquidity, and industry group representation to represent U.S. equity performance. The PSE does not mirror this index and the volatility may be materially different than the volatility of the S&P 500.
Results for the PSE as compared to the performance of the Berkshire Hathaway, Inc. (BRK.B) is for informational purposes only.
Berkshire Hathaway, Inc. engages in the provision of property and casualty insurance and reinsurance, utilities and energy, freight rail transportation, finance, manufacturing, and retailing services. The PSE does not mirror this corporation and the volatility may be materially different than the volatility of Berkshire Hathaway, Inc. (BRK.B).
Direct comparisons between the PSE’s performance and equity market indices are not without complications. The PSE’s portfolio may contain options and other derivative securities, fixed income investments, may include short sales of securities and margin trading and may not be as diversified as market indices. The indices may be unmanaged, may be market weighted, and unlike PSE, indices do not incur fees and expenses. Due to the differences among PSE’s portfolio and the performance of equity market indices, no such index is directly comparable to the PSE investment strategy.
Disclaimer 4: Forward Looking Statements/Projections
Any projections, forecasts, objectives and estimates contained in this document are necessarily speculative in nature and are based upon certain assumptions. In addition, matters they describe are subject to known (and unknown) risks, uncertainties and other unpredictable factors, many of which are beyond Pacific Point’s control. No representations or warranties are made as to the accuracy of such forward-looking statements. It can be expected that some or all of such forward-looking assumptions will not materialize or will vary significantly from actual results. Accordingly, any projections are only estimates and actual results will differ and may vary substantially from the projections or estimates shown. This presentation cannot and does not guarantee or predict a similar outcome with respect to any future investment.
Disclaimer 5: Model Returns/Back Testing
Model performance results are unaudited and do not reflect actual results of the PSE™ managed by Pacific Point. Model performance results are for illustrative purposes only and are not necessarily indicative of performance that would have been actually achieved if an investment utilized the strategy during the relevant periods, nor are these simulations necessarily indicative of future performance of the strategy. These model performance results are net of .5% advisory fees. Model returns are inclusive of the reinvestment of dividends and other earnings, including income from new issues. The model returns are based on the indicated time periods and do not give effect to high water marks, if any. Inherent limitations of model performance may include:
- Model results are generally prepared with the benefit of hindsight;
- Model results do not represent the impact that material economic and market factors might have on an investment adviser’s decision-making process if the adviser were actually managing client money;
- There are numerous factors related to the markets in general, many of which cannot be fully accounted for in the preparation of hypothetical performance results and all of which may adversely affect actual investment results.
Disclaimer 6: Specific Securities Shown
The companies and/or securities shown on the above presentation are presented for illustrative purposes only and are not necessarily actual securities held in PSE, nor is this list of companies necessarily indicative of potential or future holdings of PSE. Inclusion of such companies is not intended as a recommendation to purchase or sell any security. These companies are solely illustrative of Pacific Point’s investment strategy and are subject to change. Pacific Point may at any time adjust, increase, decrease or eliminate any of the target companies, depending on, among other things, market conditions and trends, general economic conditions and changes in Pacific Point’s investment philosophy, strategy and expectations regarding the focus, techniques, and activities of its strategy.