
Stable Earnings™ Core Portfolio Summary
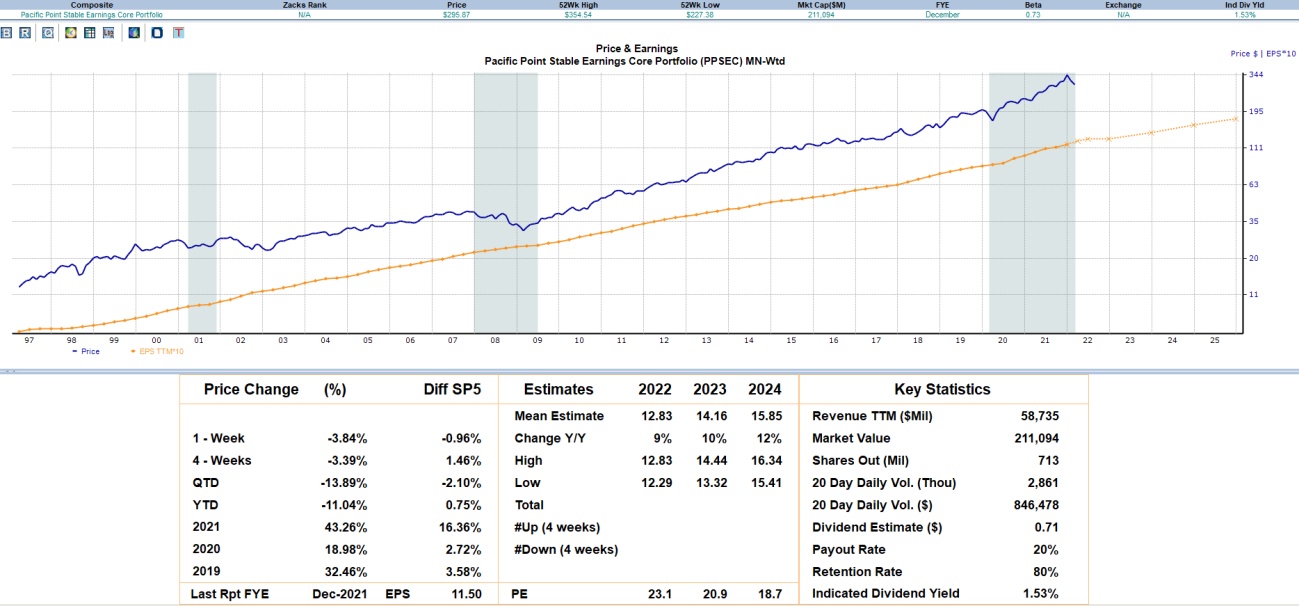
The cornerstone of the Pacific Point family of funds is the Stable EarningsTM Core equity portfolio. The Stable EarningsTM Core equity portfolio represents a concentrated, equal dollar weighted, 31-stock portfolio whose consolidated earnings have been stable over a long period of time, 25+ years.
Consolidated earnings stability at the portfolio level has historically provided the Stable EarningsTM Core equity portfolio relative levels of downside protection against loss of capital during periods of economic recession and unforeseen, black swan events.
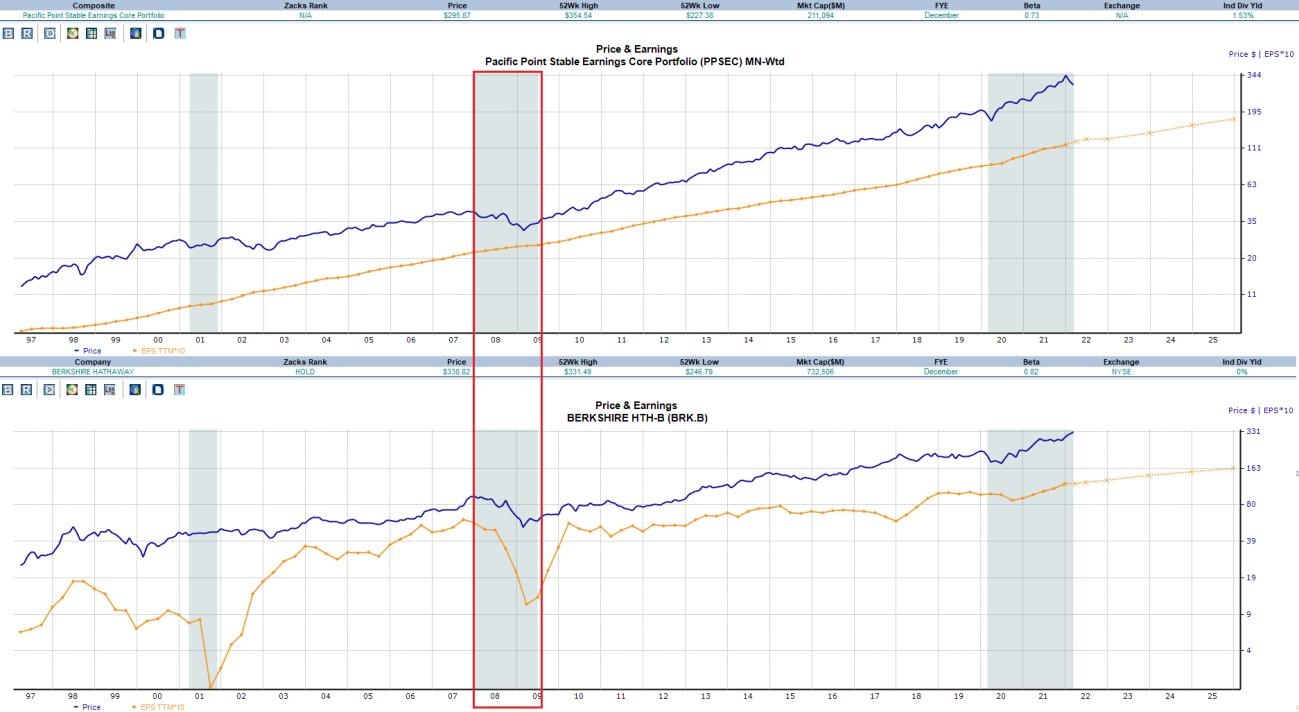
For this reason, we typically compare equity investment ideas against the Stable EarningsTM Core equity portfolio. The Price and Earnings chart below illustrates the Stable EarningsTM Core portfolio’s ability to maintain price stability (blue line) through a steady, 25-year historic EPS growth trajectory (orange line) encompassing 3 prior recessions, including the Covid induced U.S. economic shutdown of 2020.
Top Five Similarities and Differences Between Stable Earnings™ Core Portfolio and Berkshire Hathaway
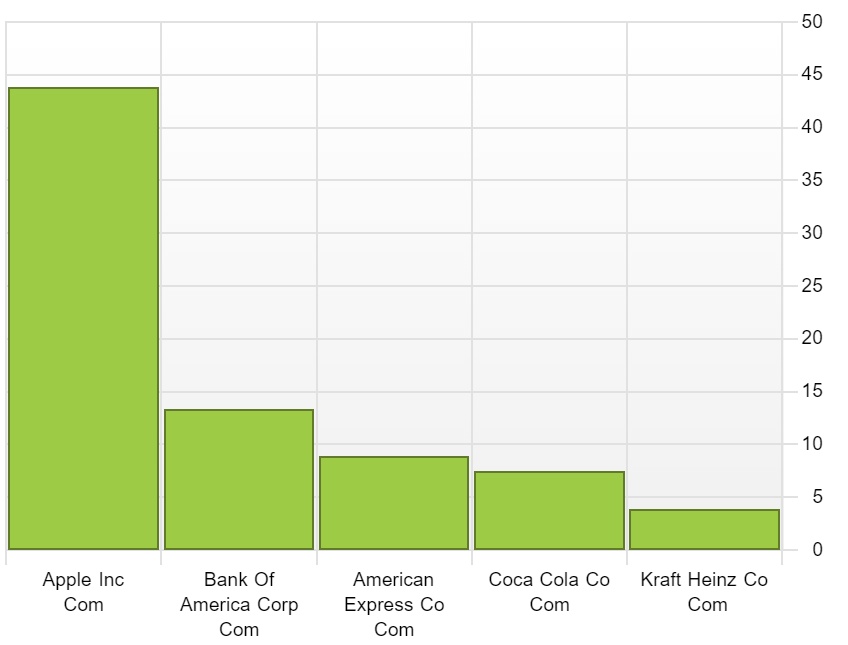
- Stable EarningsTM Core is a 31-stock strategy allocated on an equal dollar basis resulting in limited security specific risk relative to Berkshire Hathaway, who as of Q4 2021 holds 43% of their unconsolidated equity portfolio in a single stock, Apple.
- As of Q4 2021 the top five Berkshire Hathaway stock holdings equal ~77% of the unconsolidated equity portfolio. The five equal dollar weighted holdings in the Stable EarningsTM Core equates to only ~16% of the portfolio.
- Like Berkshire Hathaway, the Stable EarningsTM portfolio contains companies that provide goods and services that are used or consumed by everyone, every single day.
- Unlike Berkshire Hathaway, the Stable EarningsTM Core has no overlapping exposure to mega cap technology names like Apple.
- Like Berkshire Hathaway, portfolio companies have a demonstrated 25-year history of industry leading cash flows, profitability, capital efficiency and overall fundamental quality.
Concentration and Long-term Cyclical Holdings - Berkshire Hathaway’s Achilles Heel
Beyond the concentration of top five unconsolidated equity holdings comprising ~77% of the total portfolio, Berkshire Hathaway has long-term positions in financial, energy and other cyclical industrial holdings that have proven problematic for both valuation and earnings stability during periods of economic recession and unforeseen, black swan events.
As of Q4 2021, the Berkshire Hathaway unconsolidated equity portfolio was worth $293 billion allocated across 43 companies. In the corporate investment portfolio, the holding company has controlling interests in 70 additional businesses. As of Q4 2021, Berkshire Hathaway also had total cash on hand of $149 billion.
Company holdings within the Berkshire Hathaway corporate investment portfolio are more diversified than the unconsolidated equity portfolio. What the stock portfolio lacks in diversity, the corporate investment portfolio attempts to make up for with positive cash flow generating businesses. To provide context for the scope of concentration within the unconsolidated equity portfolio, at the end of 2021, before investors turned to Berkshire as a flight to safety trade, its stake in Apple and its cash on the balance sheet were rivaling the value that the market was giving to all the Berkshire operating companies combined.
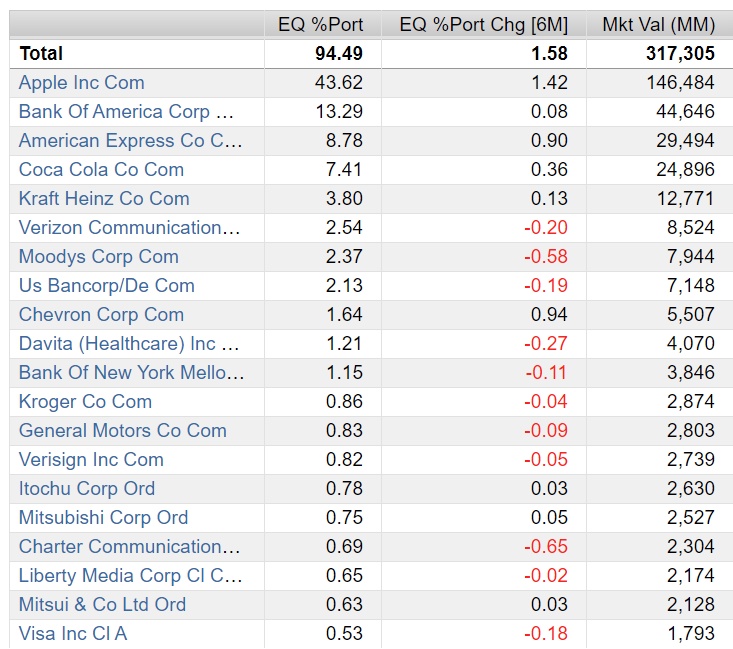
A closer look at the top 20 Berkshire Hathaway unconsolidated equity holdings, illustrated in the table below with market values as of March 2, 2022, reveals a 25% exposure to bank stocks and a 4% exposure to energy and other cyclical industrial names. This combined ~29% cyclical exposure can be problematic for Berkshire Hathaway because aggregate earnings for this sizable portion of the total portfolio are directly tied to the various phases of the U.S. economic cycle. Conversely, the Stable EarningsTM Core portfolio seeks to decouple aggregative earnings growth dependency from the various phases of the U.S. economic cycle.
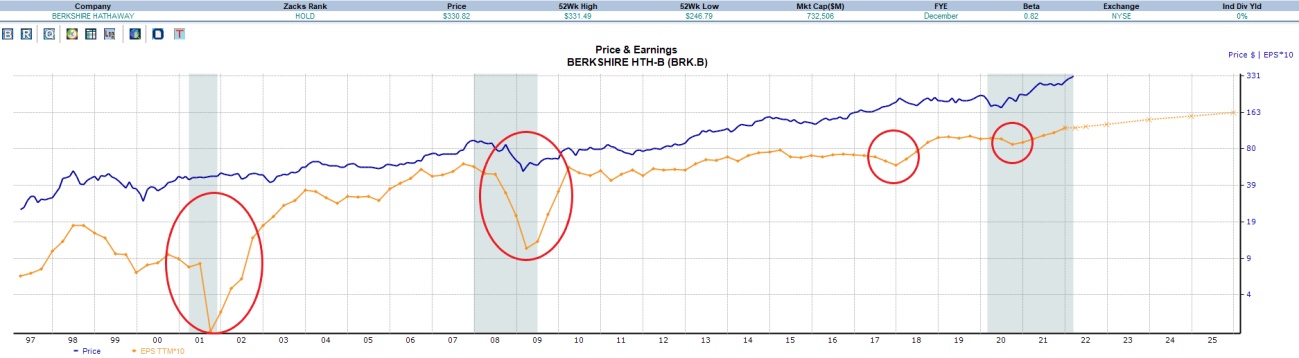
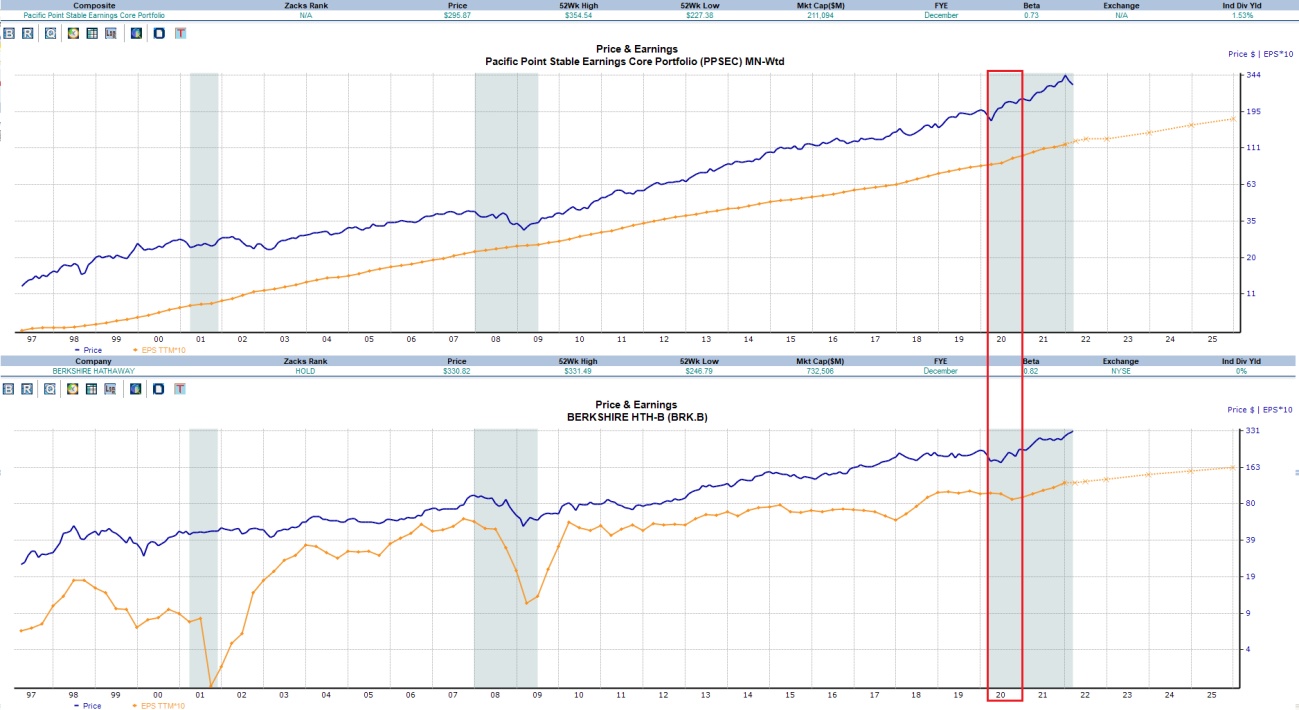
The 25-year Price and Earnings chart below illustrates the earnings growth dependency Berkshire Hathaway has tied to the various phases of the U.S. economic cycle. Since perceived earnings levels and earnings growth are the lifeblood of equity valuations, any downside variance in the earnings growth trajectory can negatively impact the valuation of Berkshire Hathaway.
Implications for Performance of Stable Earnings™ Core Portfolio versus Berkshire Hathaway
The following illustrates The Great Recession earnings drawdown comparison for the Stable EarningsTM Core portfolio vs. Berkshire Hathaway from pre-recession highs on 12/31/2007 through the end of the recession on 7/31/2009.
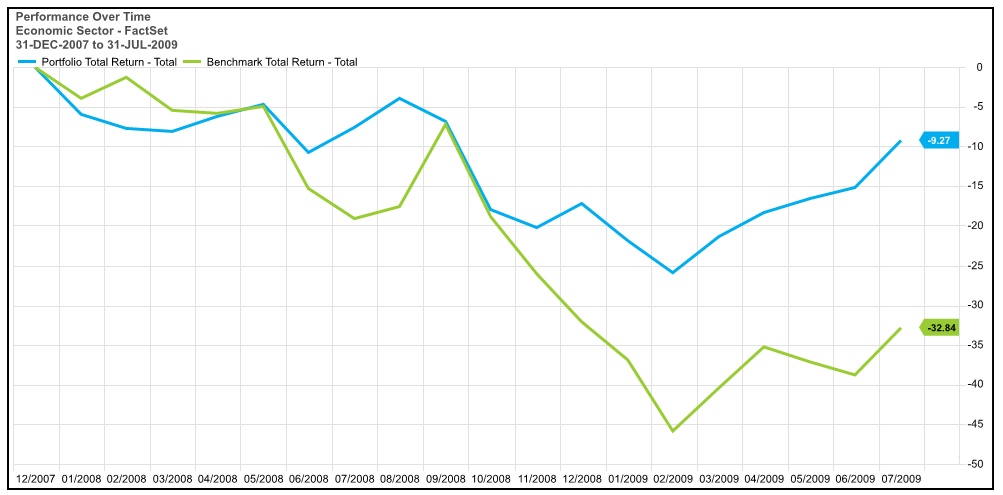
The following illustrates The Great Recession cumulative total return performance of the Stable EarningsTM Core model portfolio vs. Berkshire Hathaway from 12/31/2007 through the end of the recession on 7/31/2009.
Stable EarningsTM Core model portfolio cumulative total return -9.27%
Benchmark Total Return = Berkshire Hathaway cumulative total return -32.84%
The following illustrates the Covid-19 earnings drawdown comparison for the Stable EarningsTM Core portfolio vs. Berkshire Hathaway from 2/28/2020 through 12/31/2020.
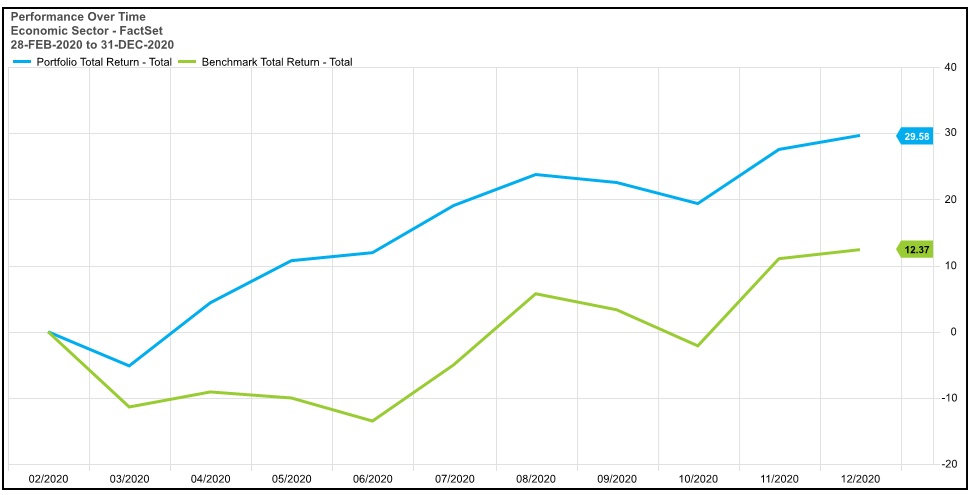
The following illustrates the Covid-19 cumulative total return performance of the Stable EarningsTM Core model portfolio vs. Berkshire Hathaway from 2/28/2020 through 12/31/2020
Stable EarningsTM Core model portfolio cumulative total return 29.58%
Benchmark Total Return = Berkshire Hathaway cumulative total return 12.37%
Long-term Performance Implications for Berkshire Hathaway Drawdowns
Mathematically speaking, for every hypothetical 50% drawdown a subsequent 100% return is required to break even. This has massive implications for theoretical long-term compounding of capital and investor returns.
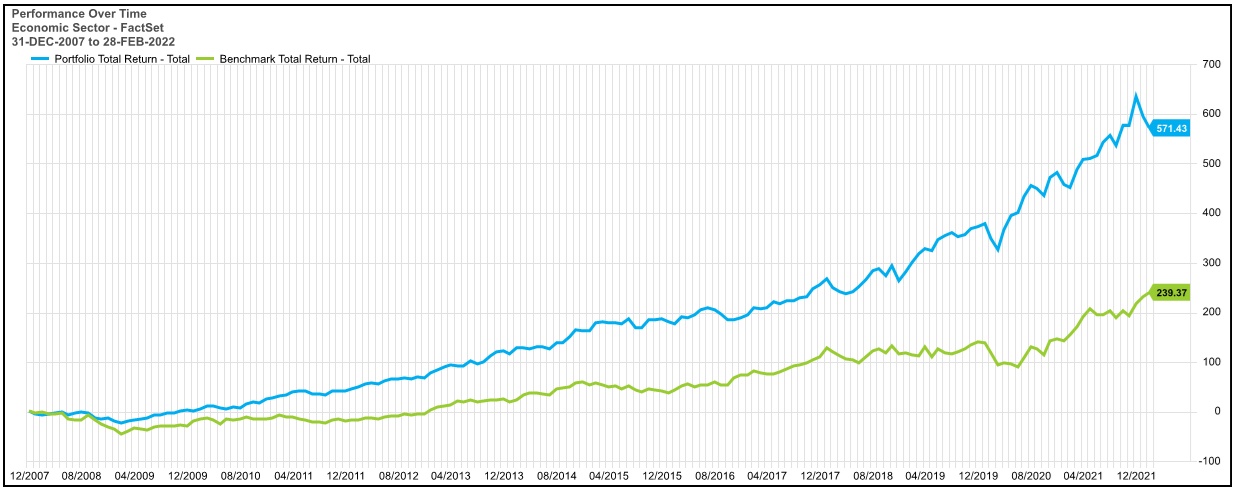
Consider the following pre-Great Recession period December 31, 2007, through February 2022. Note the difference in cumulative total return between Berkshire Hathaway, where a large portion of portfolio companies’ earnings are tied to the U.S. economic cyclical, and the Stable EarningsTM Core model portfolio that seeks to decouple aggregative earnings growth dependency from the various phases of the U.S. economic cycle.
Stable EarningsTM Core model portfolio cumulative total return 571.43%
Benchmark Total Return = Berkshire Hathaway cumulative total return 239.37%
Summary
Since the 1970’s, Warren Buffett and Charlie Munger have made long-term investments in companies that provide goods and services that are used or consumed by everyone, every single day. We endorse this investment philosophy which is very similar to our Stable EarningsTM approach. Both investment strategies seek to invest in high quality companies with strong cash flows and industry leading profitability with a long history of growing earnings. For over 50 years, Buffett has systematically worked to acquire a majority or controlling interest in these types of high-quality companies. These companies are rare, typically trade at a premium and if private, may not be investable. When these types of companies are available to purchase, they may be in cyclical sectors that are correlated to the economy
For example, in February of 2010, Berkshire acquired Burlington Northern Santa Fe Railroad (“BN”) for $36.8 billion which is a great business, but highly correlated with the U.S economic cycle
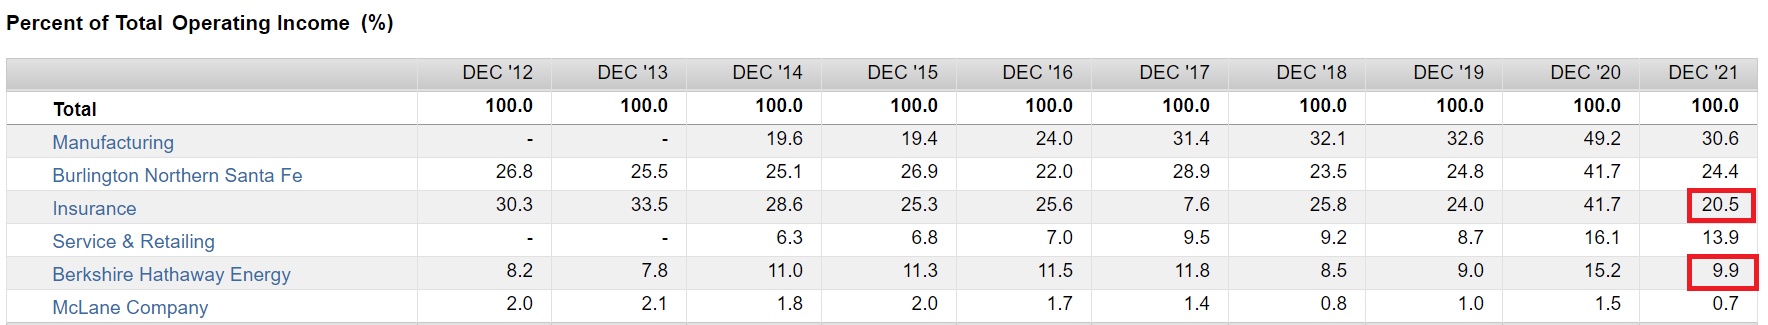
Below are FactSet data tables illustrating Berkshires sales and operating income as a percentage of the totals by segment.
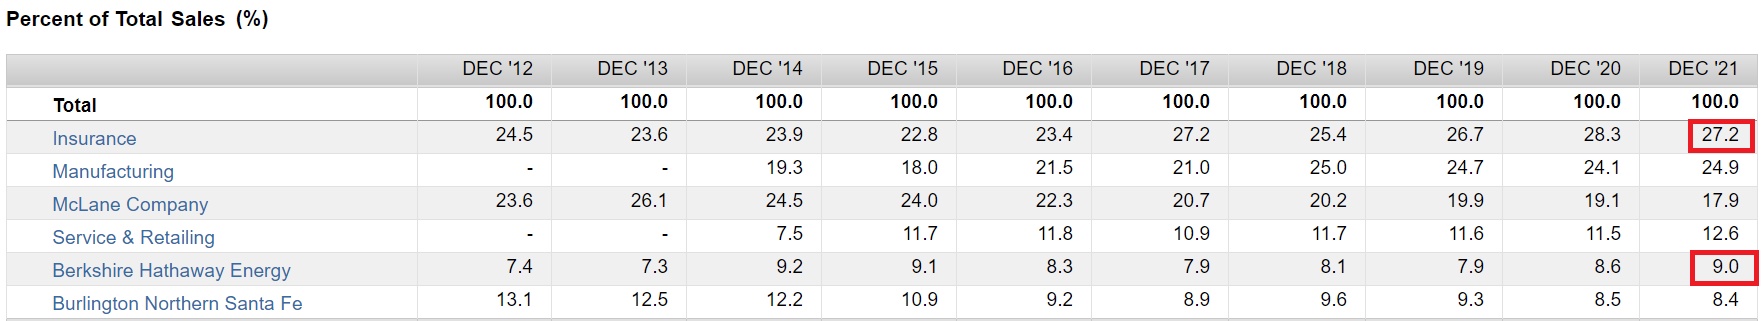
The table above illustrates that as of 2021, Insurance and Energy represent 27.2% and 9% of total sales respectively.
The following table illustrates these same two segments represent about 30% of total operating income.
In contrast, Pacific Point’s Stable EarningsTM Core investment portfolio excludes cyclical sectors such as Energy and Financials, including banks and insurance companies that are typically highly correlated to the economy. Excluding these cyclical sectors provides additional earning stability which we believe reduces drawdowns in declining equity markets. That said, Berkshire’s collection of cyclical operating companies such at GEICO are industry leaders and should perform well over long periods of time.
In addition to the risk factors described above, Berkshire Hathaway investors should consider Berkshire Hathaway’s risk profile as a large-scale catastrophic loss insurance company. While historically very profitable, these types of insurance companies can suffer significant insurance claim losses related to catastrophic losses from natural disasters and acts of aggression, such foreign conflicts abroad, including the war in Ukraine.
Warren Buffett, age 91, is commonly referred to as one of the most successful investors in the world. Since the creation of the Buffett Partnership, Ltd. In 1956, Buffett and his Vice Chairman, Charlie Munger, age 98, have proved to be world class stewards of capital, providing superior compounding of capital and returns to common equity shareholders through regular dividend increases and share buyback programs running strong to this day.
While no one can deny the 60-year track record of Buffett and Munger, investors must also look forward as opposed to backwards. Therefore, it is prudent to consider, and attempt to mitigate, the “Key Man” risk associated with the ‘cult like’ following of Warren Buffett. While Buffett and Munger have succession plans in place, there is always uncertainty around the future direction of the company post Warren Buffett.
Recommendations
Berkshire Hathaway and the Pacific Point Stable EarningsTM Core portfolio share similar investment philosophies focused on investments in high quality, essential companies used by people every day. Berkshire has acquired an impressive portfolio of investment companies and has deployed its excess and investment capital in a portfolio of publicly traded equities.
For those investors who want exposure to Berkshire Hathaway, adding an allocation of Pacific Point Stable EarningsTM Core may improve overall portfolio diversification and may improve returns and mitigate overall portfolio risk by providing added earnings stability through economic cycles and diversification by further reducing portfolio concentration and single stock risk.
General Disclaimer
This report is not an offer to sell securities of any investment fund, a solicitation of offers to buy any such securities, or a solicitation to open a separately managed account with Pacific Point Advisors, LLC (“Pacific Point”).
An investment in any strategy, including the Pacific Point Stable Earnings™ Stock Portfolio strategy (the “PSE”) described herein, involves a high degree of risk. The PSE is not an actual index but represents the hypothetical performance of a concentrated basket of stocks picked by Pacific Point, with the benefit of hindsight. There is no guarantee that the investment objective will be achieved. Past performance of these strategies is not necessarily indicative of future results. There is the possibility of loss, and all investment involves risk including the loss of principal.
The information in this presentation was prepared by Pacific Point and is believed by Pacific Point to be reliable and has been obtained from public sources believed to be reliable. Pacific Point makes no representation as to the accuracy or completeness of such information. Opinions, estimates and projections in this presentation constitute the current judgment of Pacific Point and are subject to change without notice. Any projections, forecasts and estimates contained in this presentation are necessarily speculative in nature and are based upon certain assumptions. It can be expected that some or all of such assumptions will not materialize or will vary significantly from actual results. Accordingly, any projections are only estimates and actual results will differ and may vary substantially from the projections or estimates shown. This presentation is not intended as a recommendation to purchase or sell any commodity or security. Pacific Point has no obligation to update, modify or amend this presentation or to otherwise notify a reader thereof in the event that any matter stated herein, or any opinion, project on, forecast or estimate set forth herein, changes or subsequently becomes inaccurate.
This research report is strictly confidential and may not be reproduced or redistributed in whole or in part nor may its contents be disclosed to any other person without the express consent of the Pacific Point.
ALL STATEMENTS IN THIS PRESENTATION ARE THE OPINIONS OF PACIFIC POINT, UNLESS OTHERWISE SPECIFIED.
Additional Disclaimers
Disclaimer 1: Investment Strategy
The description herein of the approach of Pacific Point and the targeted characteristics of the PSE™ strategy and investments is based on current expectations and should not be considered definitive or a guarantee that the approaches, strategies, and investment portfolio will, in fact, possess these characteristics. In addition, the description herein of the PSE’s risk management strategies is based on current expectations and should not be considered definitive or a guarantee that such strategies will reduce all risk. These descriptions are based on information available as of the date of preparation of this document, and the description may change over time. Past performance, model performance, and back testing of these strategies is not necessarily indicative of future results. There is the possibility of loss and all investment involves risk including the loss of principal.
Disclaimer 2: Graphs and Charts
The graphs, charts and other visual aids are provided for informational purposes only. None of these graphs, charts or visual aids can and of themselves be used to make investment decisions. No representation is made that these will assist any person in making investment decisions and no graph, chart or other visual aid can capture all factors and variables required in making such decisions.
Disclaimer 3: Indices
References to market or composite indices, benchmarks, or other measures of relative market performance over a specified period of time may be presented to show general trends in the markets for the applicable period and are not intended to imply that the PSE is benchmarked to any indices either in composition or level of risk. Benchmark data is provided for comparative purposes only. Reference or comparison to an index does not imply that the portfolio will be constructed in the same way as an index or achieve returns, volatility, or other results similar to the index.
Indices are unmanaged, include the reinvestment of dividends and do not reflect transaction costs or any performance fees. Unlike indices, the PSE will be actively managed and may include substantially fewer and different securities than those comprising each index. Results for the PSE as compared to the performance of the Standard & Poor’s 500 Index (the “S&P 500”) is for informational purposes only. The S&P 500 is an unmanaged market capitalization-weighted index of 500 common stocks chosen for market size, liquidity, and industry group representation to represent U.S. equity performance. The PSE does not mirror this index and the volatility may be materially different than the volatility of the S&P 500.
Results for the PSE as compared to the performance of the Standard & Poor’s 500 Index (the “S&P 500”), is for informational purposes only. The S&P 500 is an unmanaged market capitalization-weighted index of 500 common stocks chosen for market size, liquidity, and industry group representation to represent U.S. equity performance. The PSE does not mirror this index and the volatility may be materially different than the volatility of the S&P 500.
Results for the PSE as compared to the performance of the Berkshire Hathaway, Inc. (BRK.B) is for informational purposes only.
Berkshire Hathaway, Inc. engages in the provision of property and casualty insurance and reinsurance, utilities and energy, freight rail transportation, finance, manufacturing, and retailing services. The PSE does not mirror this corporation and the volatility may be materially different than the volatility of Berkshire Hathaway, Inc. (BRK.B).
Direct comparisons between the PSE’s performance and equity market indices are not without complications. The PSE’s portfolio may contain options and other derivative securities, fixed income investments, may include short sales of securities and margin trading and may not be as diversified as market indices. The indices may be unmanaged, may be market weighted, and unlike PSE, indices do not incur fees and expenses. Due to the differences among PSE’s portfolio and the performance of equity market indices, no such index is directly comparable to the PSE investment strategy.
Disclaimer 4: Forward Looking Statements/Projections
Any projections, forecasts, objectives and estimates contained in this document are necessarily speculative in nature and are based upon certain assumptions. In addition, matters they describe are subject to known (and unknown) risks, uncertainties and other unpredictable factors, many of which are beyond Pacific Point’s control. No representations or warranties are made as to the accuracy of such forward-looking statements. It can be expected that some or all of such forward-looking assumptions will not materialize or will vary significantly from actual results. Accordingly, any projections are only estimates and actual results will differ and may vary substantially from the projections or estimates shown. This presentation cannot and does not guarantee or predict a similar outcome with respect to any future investment.
Disclaimer 5: Model Returns/Back Testing
Model performance results are unaudited and do not reflect actual results of the PSE™ managed by Pacific Point. Model performance results are for illustrative purposes only and are not necessarily indicative of performance that would have been actually achieved if an investment utilized the strategy during the relevant periods, nor are these simulations necessarily indicative of future performance of the strategy. These model performance results are net of .5% advisory fees. Model returns are inclusive of the reinvestment of dividends and other earnings, including income from new issues. The model returns are based on the indicated time periods and do not give effect to high water marks, if any. Inherent limitations of model performance may include:
- Model results are generally prepared with the benefit of hindsight;
- Model results do not represent the impact that material economic and market factors might have on an investment adviser’s decision-making process if the adviser were actually managing client money;
- There are numerous factors related to the markets in general, many of which cannot be fully accounted for in the preparation of hypothetical performance results and all of which may adversely affect actual investment results.
Disclaimer 6: Specific Securities Shown
The companies and/or securities shown on the above presentation are presented for illustrative purposes only and are not necessarily actual securities held in PSE, nor is this list of companies necessarily indicative of potential or future holdings of PSE. Inclusion of such companies is not intended as a recommendation to purchase or sell any security. These companies are solely illustrative of Pacific Point’s investment strategy and are subject to change. Pacific Point may at any time adjust, increase, decrease or eliminate any of the target companies, depending on, among other things, market conditions and trends, general economic conditions and changes in Pacific Point’s investment philosophy, strategy and expectations regarding the focus, techniques, and activities of its strategy.