
Primer for Navigating a Full Market Cycle
Over the past month, renewed fears of an inflation shock sent stock and bond prices to new yearly lows amid fears that the Federal Reserve could be forced to take more drastic measures to tame increases in consumer prices. On July 13, 2022, the U.S. Labor Department reported a four-decade high year-over-year change in June Headline CPI of 9.1% and Core CPI of 5.9%. While economists and strategists have become obsessed with the more volatile food and energy component of CPI, we have been focused on the shelter component of CPI because of its outsized weight in the basket of consumer price categories, overall contribution to U.S. GDP growth, and market cycles with the propensity to take years to play out.
Shelter makes up nearly a third of the basket for Headline CPI inflation and 40 percent of the basket for Core CPI, which excludes the volatile food and energy components. Housing’s average combined contribution to annual U.S. GDP stands at 15%-18% and occurs in two ways:
- Residential investment (3-5% of GDP), which includes the construction of new single-family and multifamily structures, residential remodeling, production of manufactured homes, and brokers’ fees.
- Consumption spending on housing services (12-13% of GDP), which includes gross rents and utilities paid by renters, as well as owners’ imputed rents and utility payments.
On June 1, 2022, JPMorgan Chase CEO Jamie Dimon told a group of investors he was preparing the largest U.S. bank for an economic “hurricane” on the horizon and advised investors to do the same. In the words of Jamie Dimon, while conditions seem “fine” at the moment, nobody knows if the hurricane is “a minor one or Superstorm Sandy.”
We believe the current market dynamics are setting in motion the potential for a slow-rolling real estate correction that may take years to play out and will feature key differences compared to the Financial Crisis era correction.
The following are key metrics we monitor as the U.S. real estate market transitions from its 14-year growth phase to maturity and ultimately normalizing through its correction as supply and demand for housing seek longer-term equilibrium.
Quantitative Easing, Mortgage Rates and California Home Prices
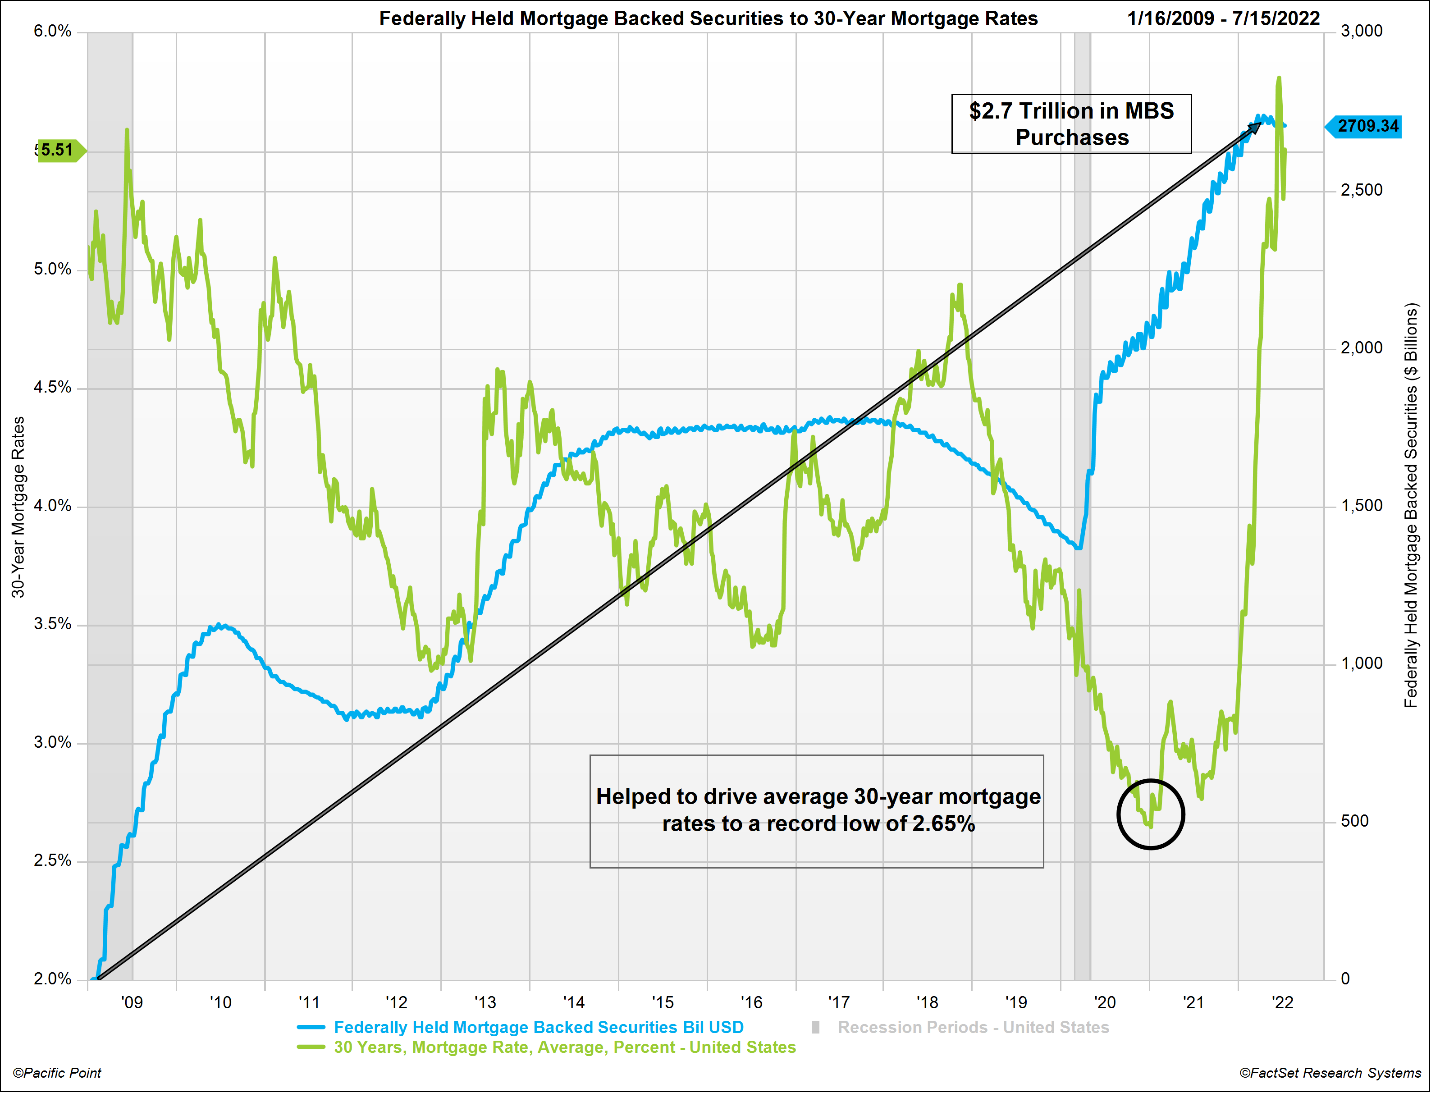
Quantitative easing or “QE” takes place when a central bank purchases assets to reduce interest rates, increase the supply of money, and drive increased lending activity to consumers and businesses. The goal is to stimulate economic activity during periods of financial distress to keep credit markets liquid and flowing. Since the start of the Financial Crisis, the Federal Reserve has purchased mortgage-backed securities (MBS) on an indiscriminate basis, through numerous rounds of QE initiatives. The Fed announced the first round of QE in November of 2008 and by 2022, had added $2.7 trillion in MBS to the Fed balance sheet.
The chart below illustrates that since 2009, QE initiatives have added $2.7 trillion in MBS to the Fed balance sheet (blue line), ultimately driving down average 30-year mortgage rates (green line) from 6.63% in 2008 to a record low of 2.65% in 2021. Since January 2022, inflation expectations have embedded longer-term, sending 30-year mortgage rates back to 14-year highs.
*Please see disclaimer 1.
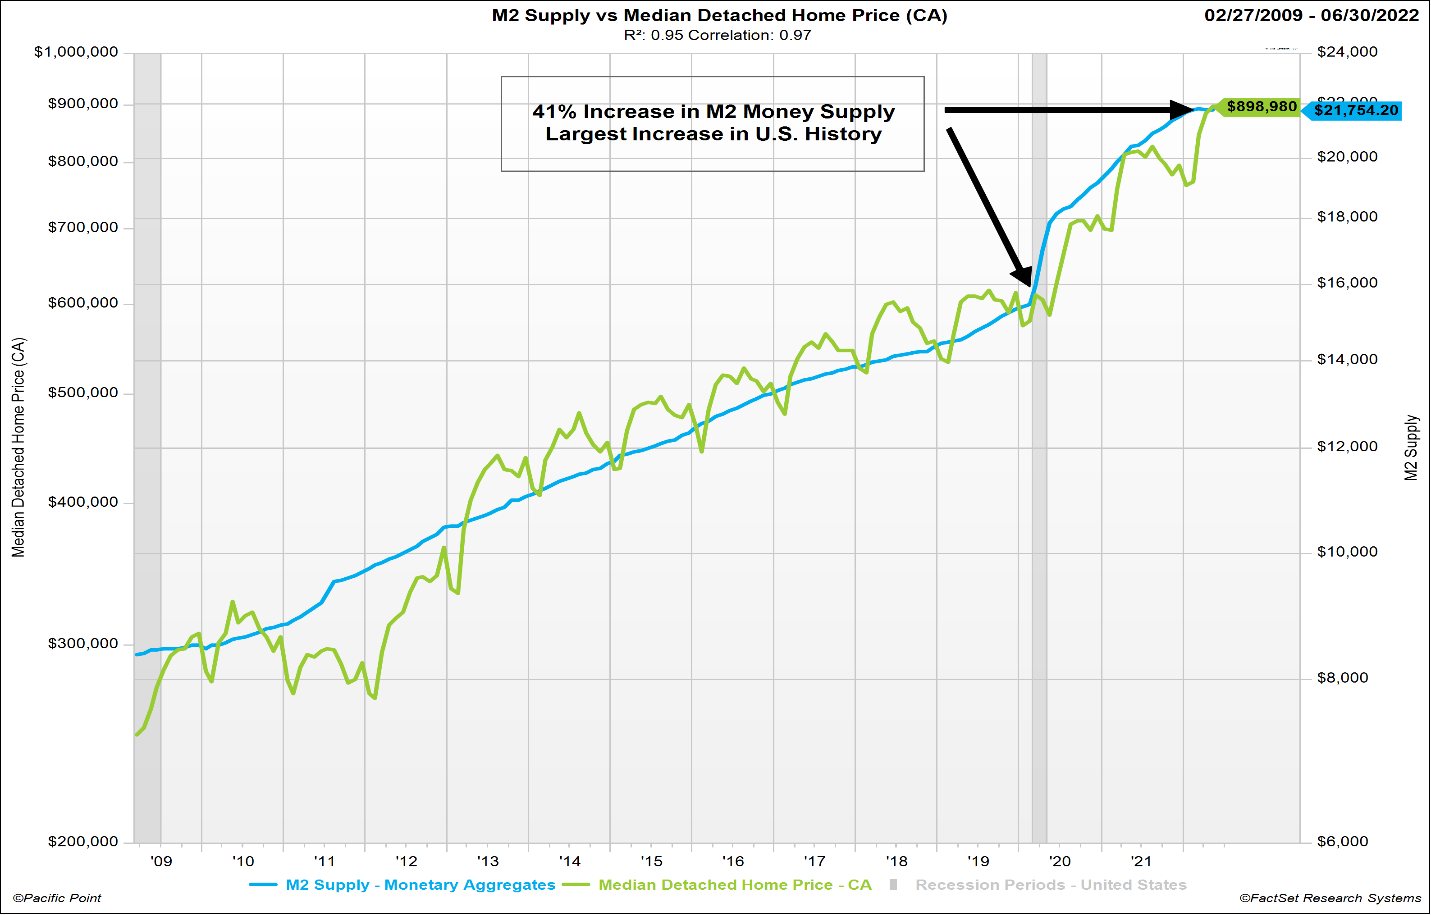
When a central bank deploys QE, the amount of money circulating in an economy increases, which helps lower long-term interest rates. This lowers the cost of borrowing, which fuels economic growth increasing demand for housing and other tangible assets.
The chart and regression statistics below illustrate a strong correlation between the expansion of the U.S. money supply and median home prices in the state of California since March of 2009. The regression R2 suggests statistical significance with money supply explaining 95% of the change in home prices in the state of California since March 2009. The average price of a home in the state of California increased at an annualized rate of 7.5%, from $250K in March 2009 to $899K by June 2022. During this same period, the supply of money circulating in the U.S. economy increased at an annualized rate of 10.1%, from $8.8 trillion to over $21.7 trillion.
The Fed response to the Covid recession was the largest and fastest rate of money supply increase in U.S. history. From February 2020 to March 2022, the money supply increased from $15.5 trillion to $21.8 trillion, respectively, a 41% increase in the total amount of money circulating in the U.S. economy in only 25 months. Median home prices in California rose 46% over the same period.
*Please see disclaimer 1.
Years of overstimulating the U.S. economy with QE collided with the post-Covid era of full employment, consumer demand, a war in Ukraine and supply chain bottlenecks. The resulting supply and demand imbalances have propelled inflation to 40-year record highs. In response, since the start of the 2022, U.S. credit markets have taken forward guidance from the Federal Reserve and have priced in over a year’s worth of Fed Funds rate increases into the first half of 2022. As a result, the average 30-year fixed rate mortgage has jumped from 3.25% at the start of the year to over 6% by mid-June.
The chart below illustrates the post-Financial Crisis trend in average 30-year fixed mortgage rates with emphasis placed on the magnitude of change in 2022. The 2022 year-to-date change in average 30-year fixed mortgage rates (black arrow/circles) represents the fastest and most significant increase in mortgage rates in the post-Financial Crisis era.

*Please see disclaimers 1.
Quantitative Easing and U.S. Housing Prices
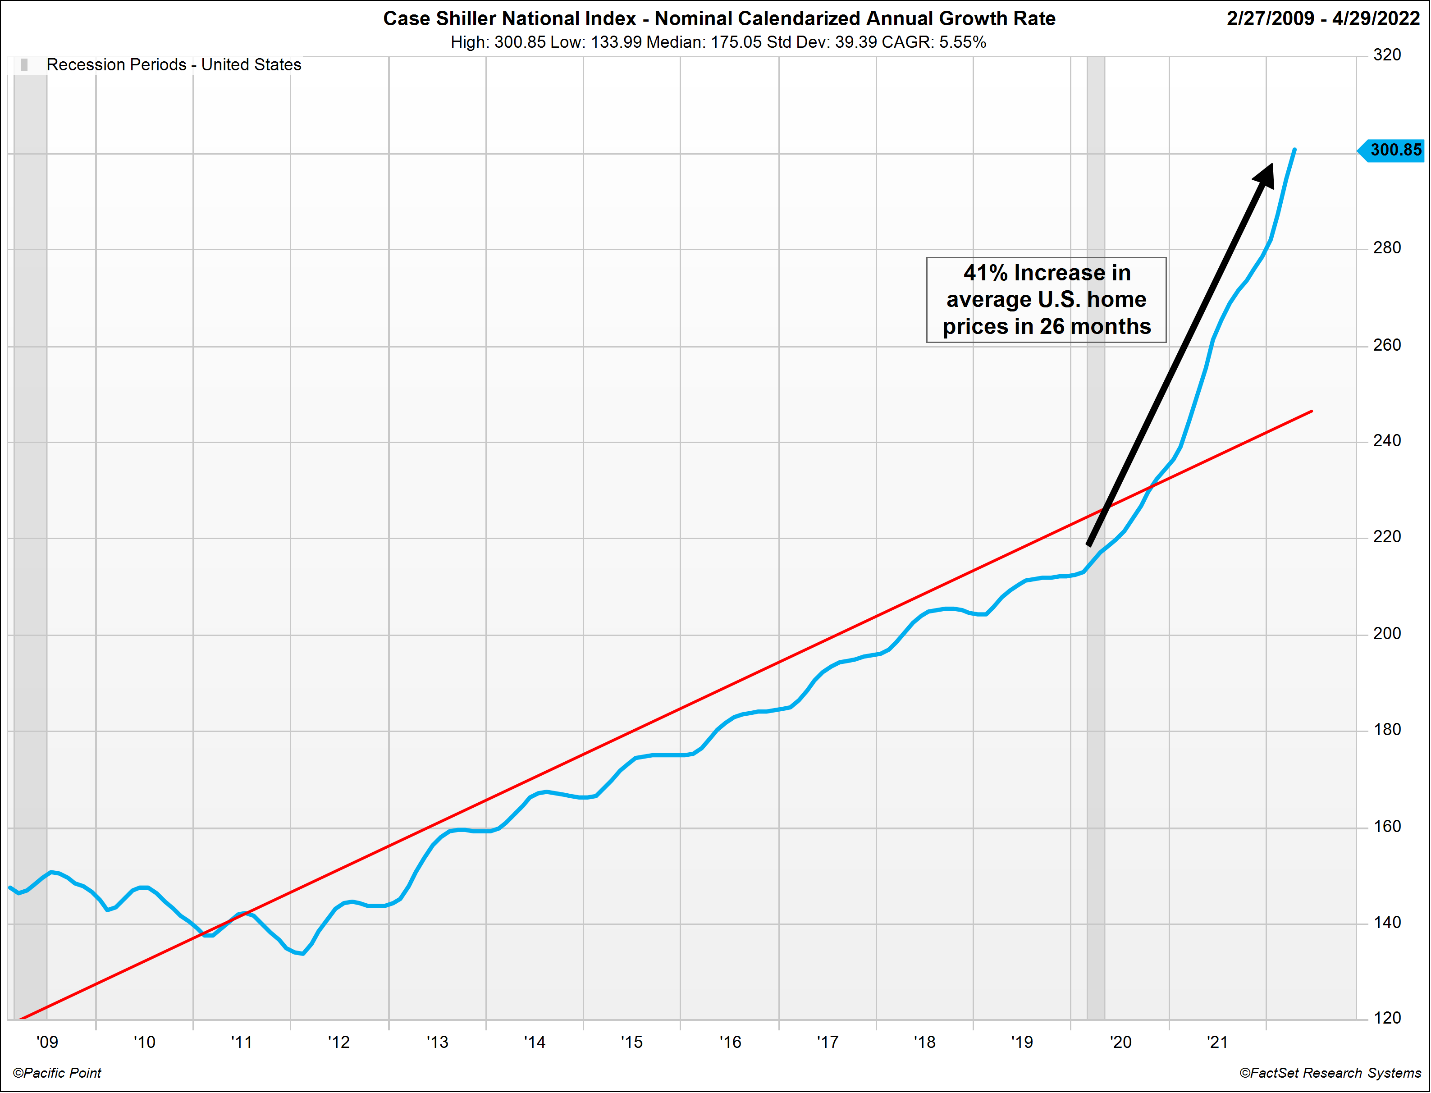
The chart below illustrates the Case Shiller Nominal U.S. Housing Price Index (not adjusted for inflation) since 2009 has increased at an annualized rate of 5.55%, from 147.6 in February 2009 to 300.9 in April 2022.
From February 2020 to April 2022 (black arrow), the nominal U.S. housing price index increased from 213.3 to 300.9 respectively, a 41% increase in only 26 months. Recall from the chart on page 3, the money supply also increased 41% over the same timeframe.
The red line in the chart below illustrates a linear regression of the post-Financial Crisis Case Shiller Nominal U.S. Housing Price Index. The 5.55% regression line slope represents the annual growth rate of national home prices in nominal terms since 2009.
*Please see disclaimer 1.
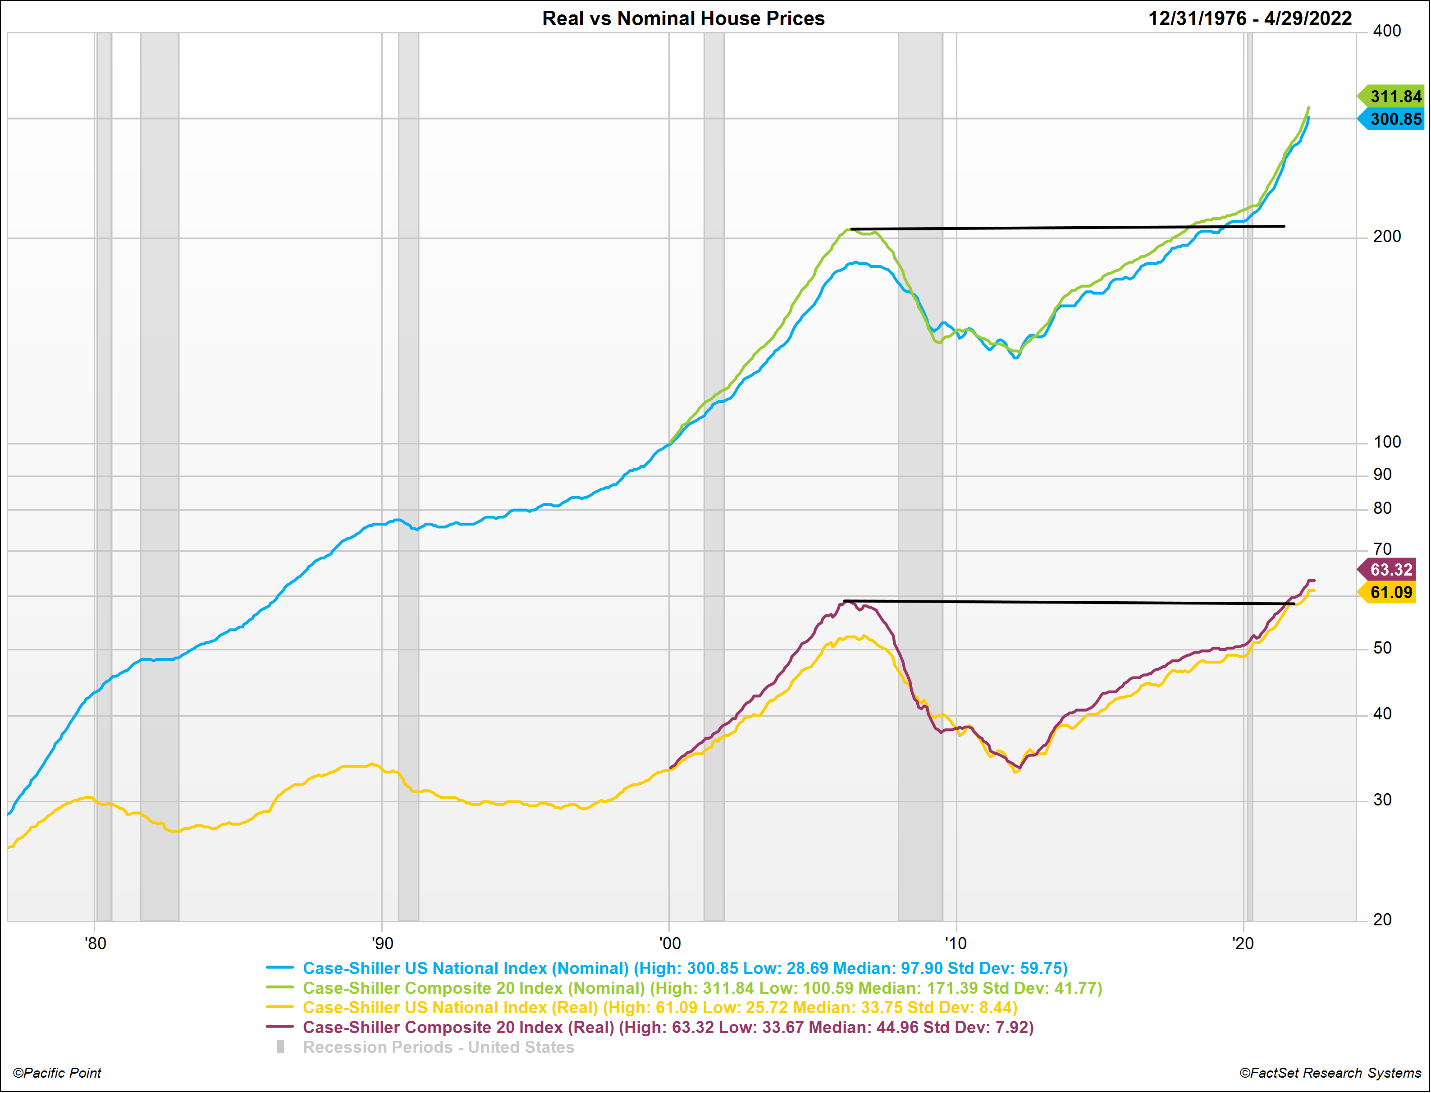
Nominal U.S. Housing Prices
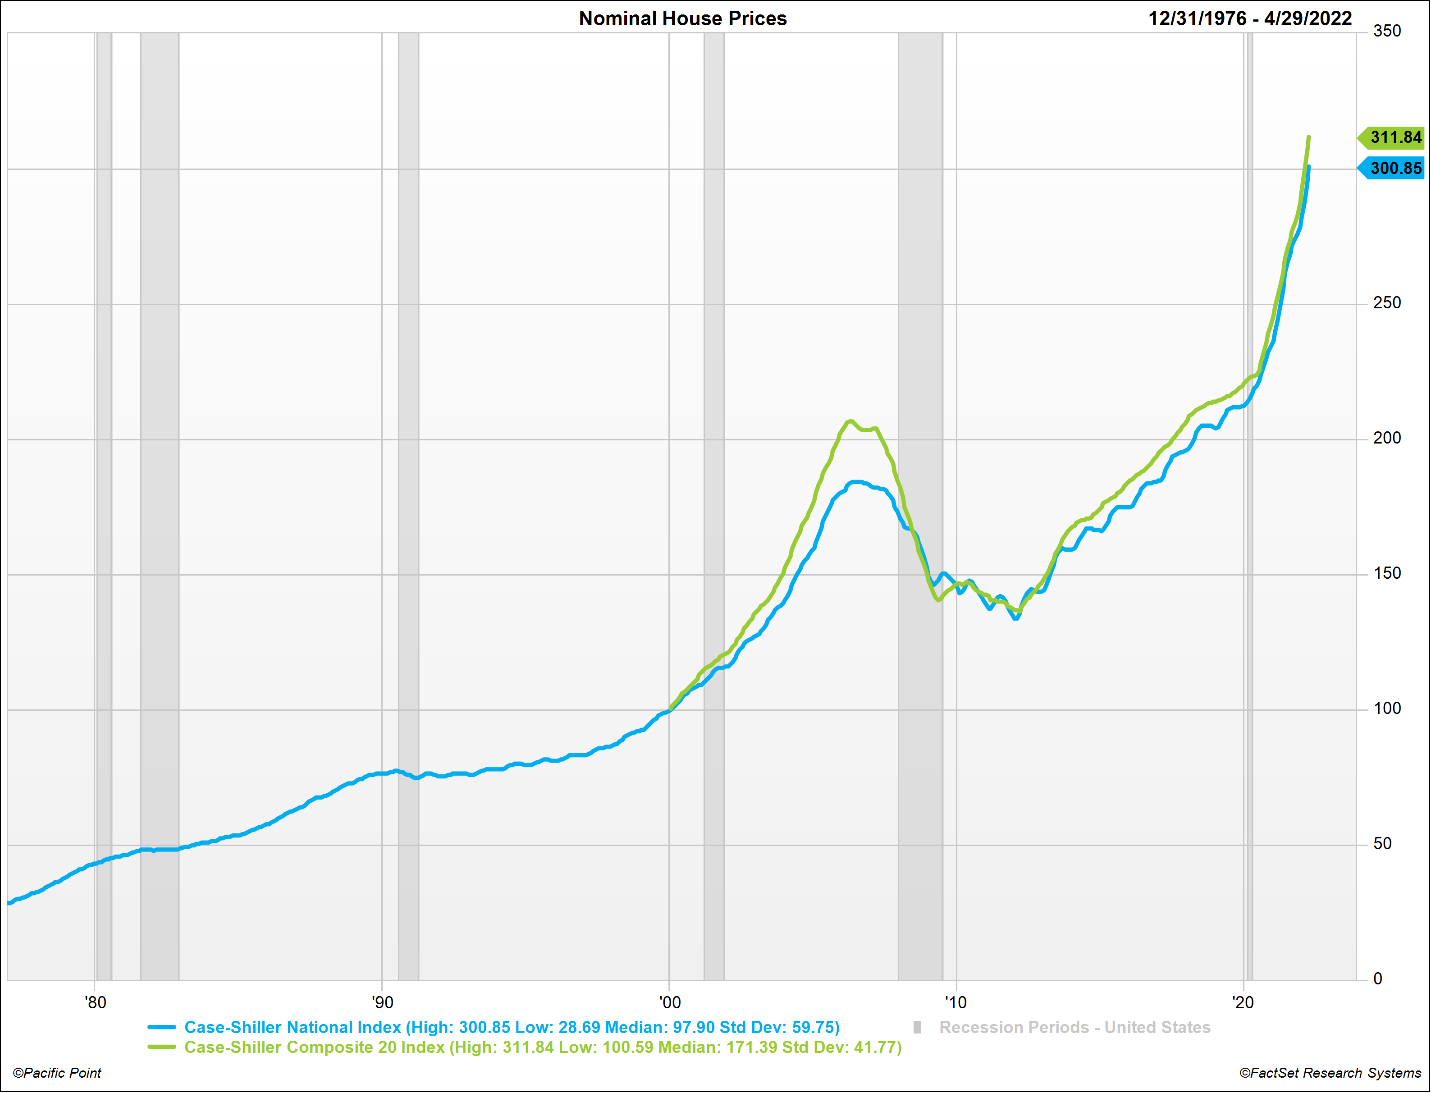
Since 2020, both the Case-Shiller National index and the Case-Shiller Composite 20 City index have forged new highs each month in nominal terms. Both housing indices are at record highs, well in excess of Great Recession peak levels. The National Index (blue line) is 63% above its Great Recession peak, and the Composite 20 Index (green line) is 51% above its Great Recession peak.
The chart below shows a 46-year history of monthly Case-Shiller National and 20 City housing indices seasonally adjusted through April 2022, in nominal terms as reported.
Please see disclaimer 1.
Real U.S. Housing Prices
The chart below shows the same 46-year history of monthly Case-Shiller National and Composite 20 City housing indices in real terms. Inflation adjustments are made by Pacific Point using CPI less shelter as reported by the U.S. Department of Labor.
Note that both real housing indices (red/yellow lines) and nominal housing indices (green/blue lines) are above Great Recession highs. The National Index adjusted for inflation (red line) is 17% above its Great Recession peak, and the Composite 20 City index adjusted for inflation (yellow line) is 8% above its Great Recession peak.
Please see disclaimer 1.
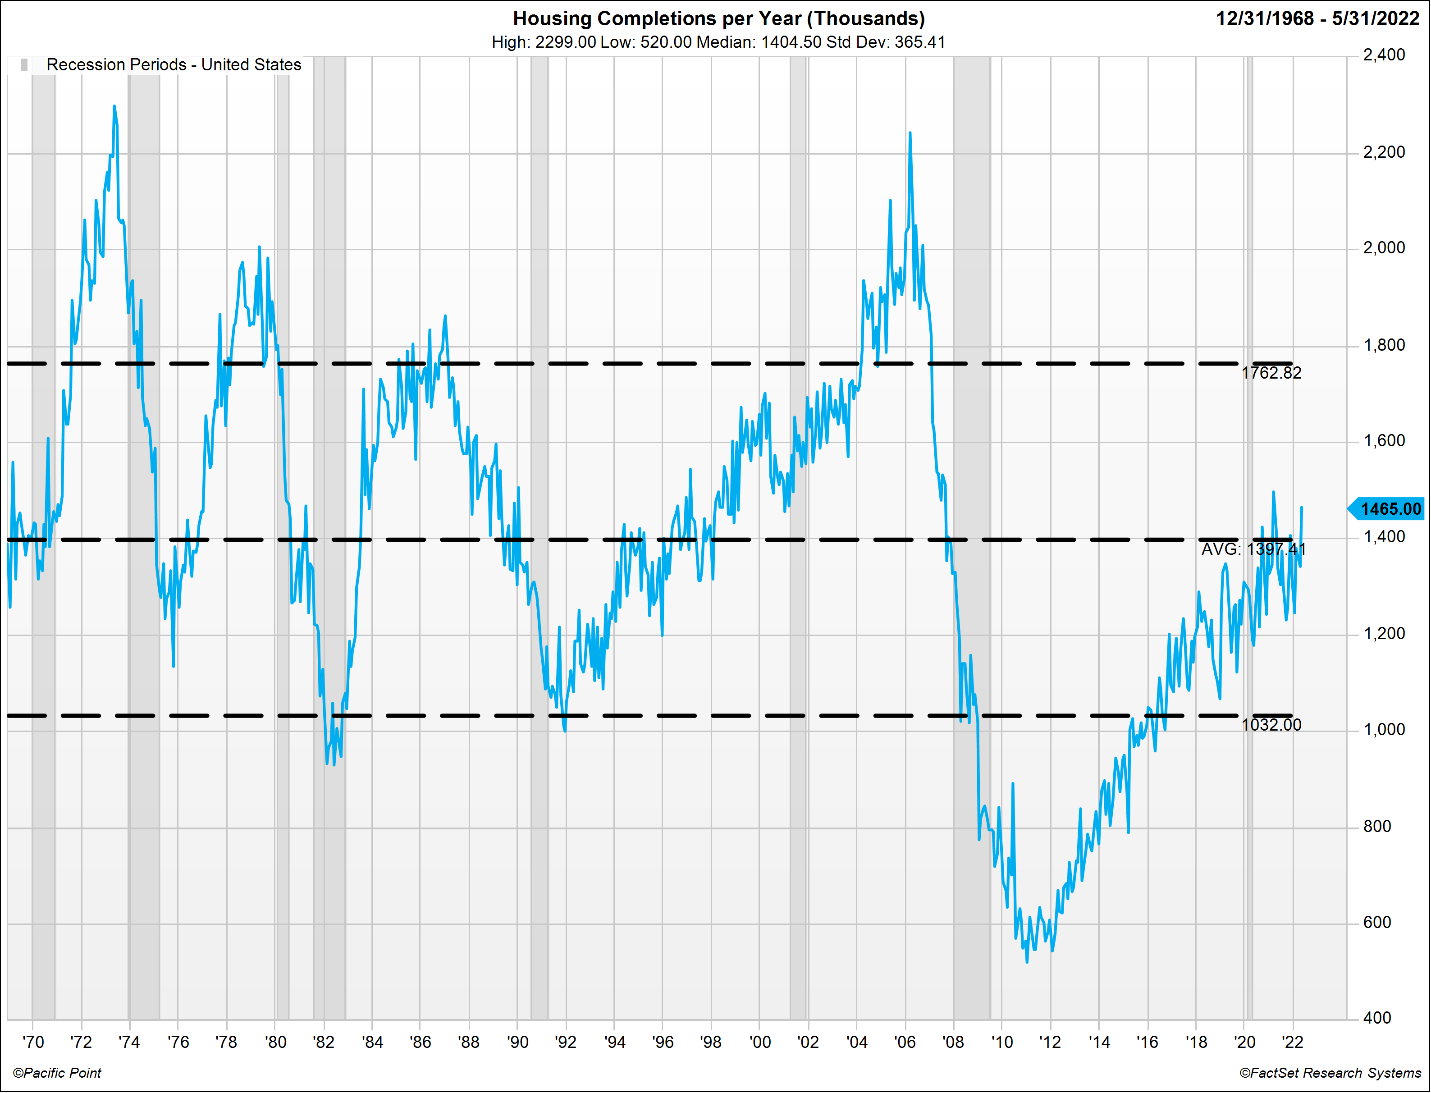
14-Year Housing Completion Trough Constrains Supply of U.S. Housing
The chart below is a 53-year history of U.S. Housing Completions per year scaled in thousands of units. The mean and +1/-1 standard deviation lines are shown as a measure of central tendency illustrating housing completion dispersion around the mean over the prior 53 years.
U.S. housing completions plunged to record lows after the Financial Crisis as financing for home purchases dried up. Starting in 2008, housing completions trended in a 14-year deficit relative to the 1.4 million units per year, on average, required to keep up with population growth. We believe the most recent 14 years’ housing completion deficit has constrained supply relative to the demand for residential housing in the U.S.
Please see disclaimer 1.
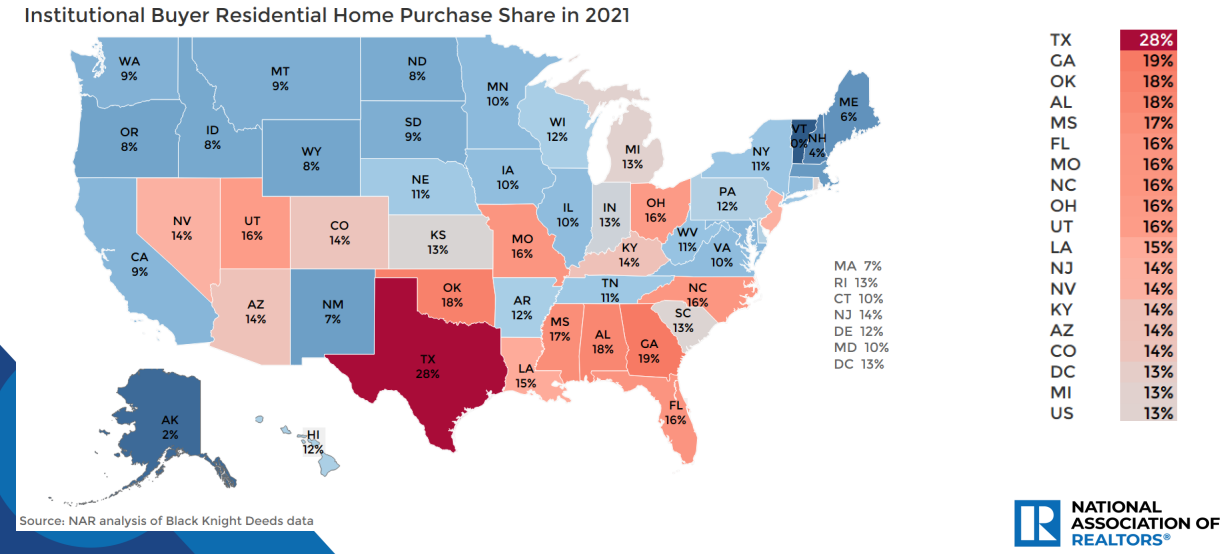
Demand from Institutional Buyers
According to the National Association of Realtors and Black Knight Deeds data, 2021 Institutional buyer share rose in 84% of states, including the District of Columbia. Institutional buyers account for 15% of residential purchases in the U.S. in 2021.
The chart below illustrates institutional buyer residential home purchase share by state in the U.S. The ten states with the highest institutional buyer market share were Texas 28%, Georgia 19%, Oklahoma 18%, Alabama 18%, Mississippi 17%, Florida 16%, Missouri 16%, North Carolina 16%, Ohio 16%, and Utah 16%.
When coupled with the Covid era migration away from city living, we believe growing demand from institutional buyers has further constrained the residential housing supply. This will likely remain a factor for the foreseeable future as the shift in demand from urban to rural and suburban shelter continues to evolve.
Please see disclaimer 1.
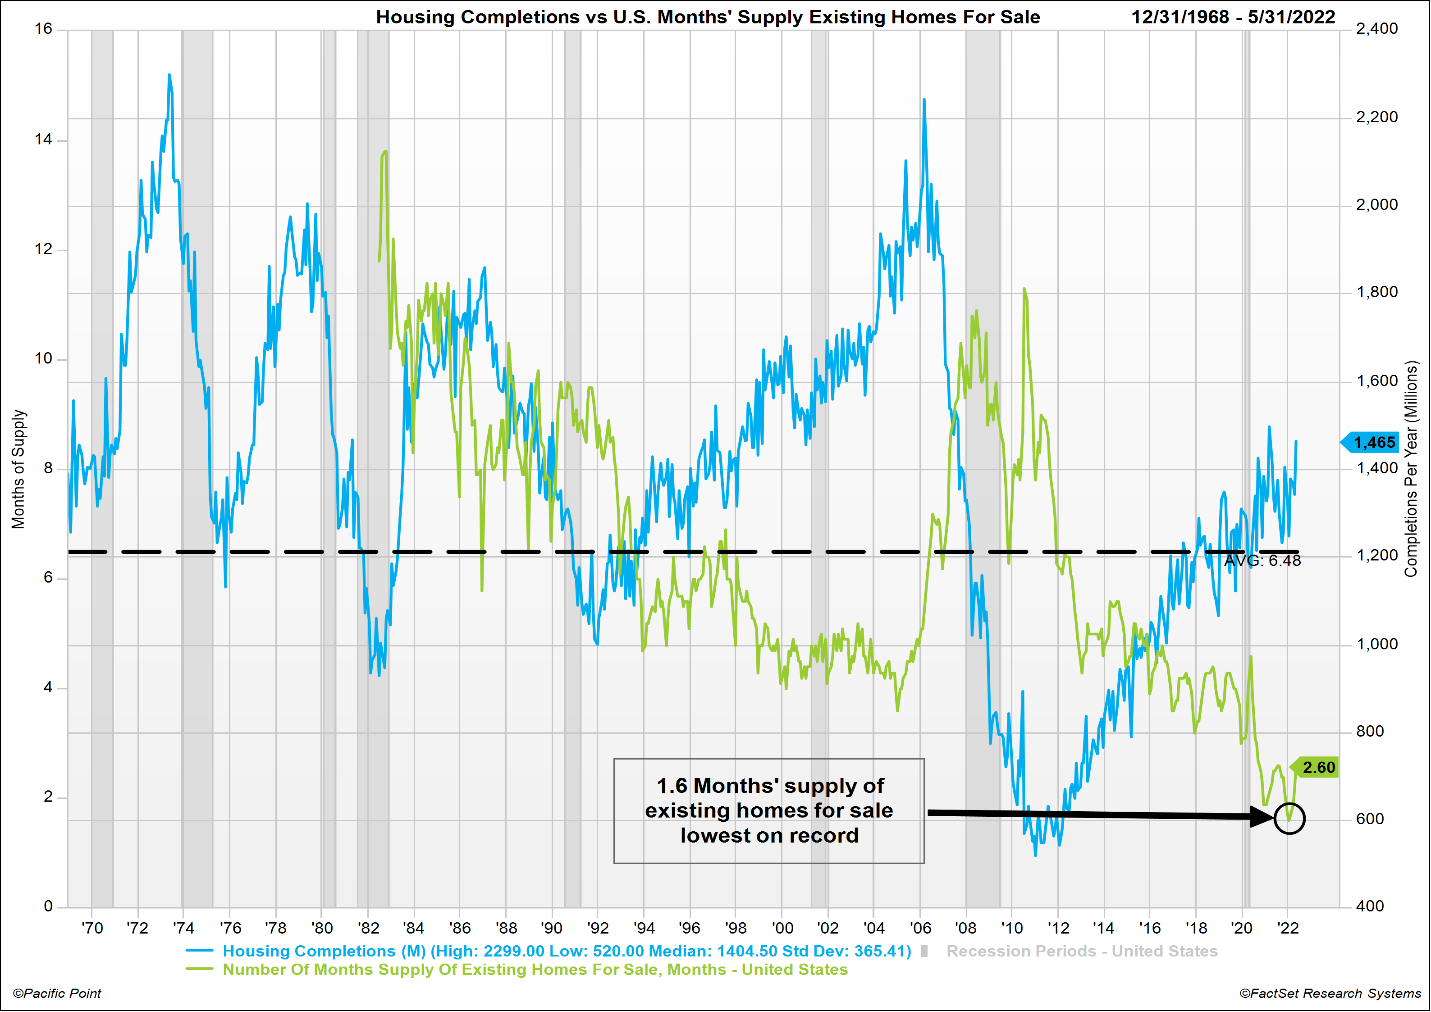
QE & Covid Demand for Housing Collided with Inadequate U.S. Housing Supply
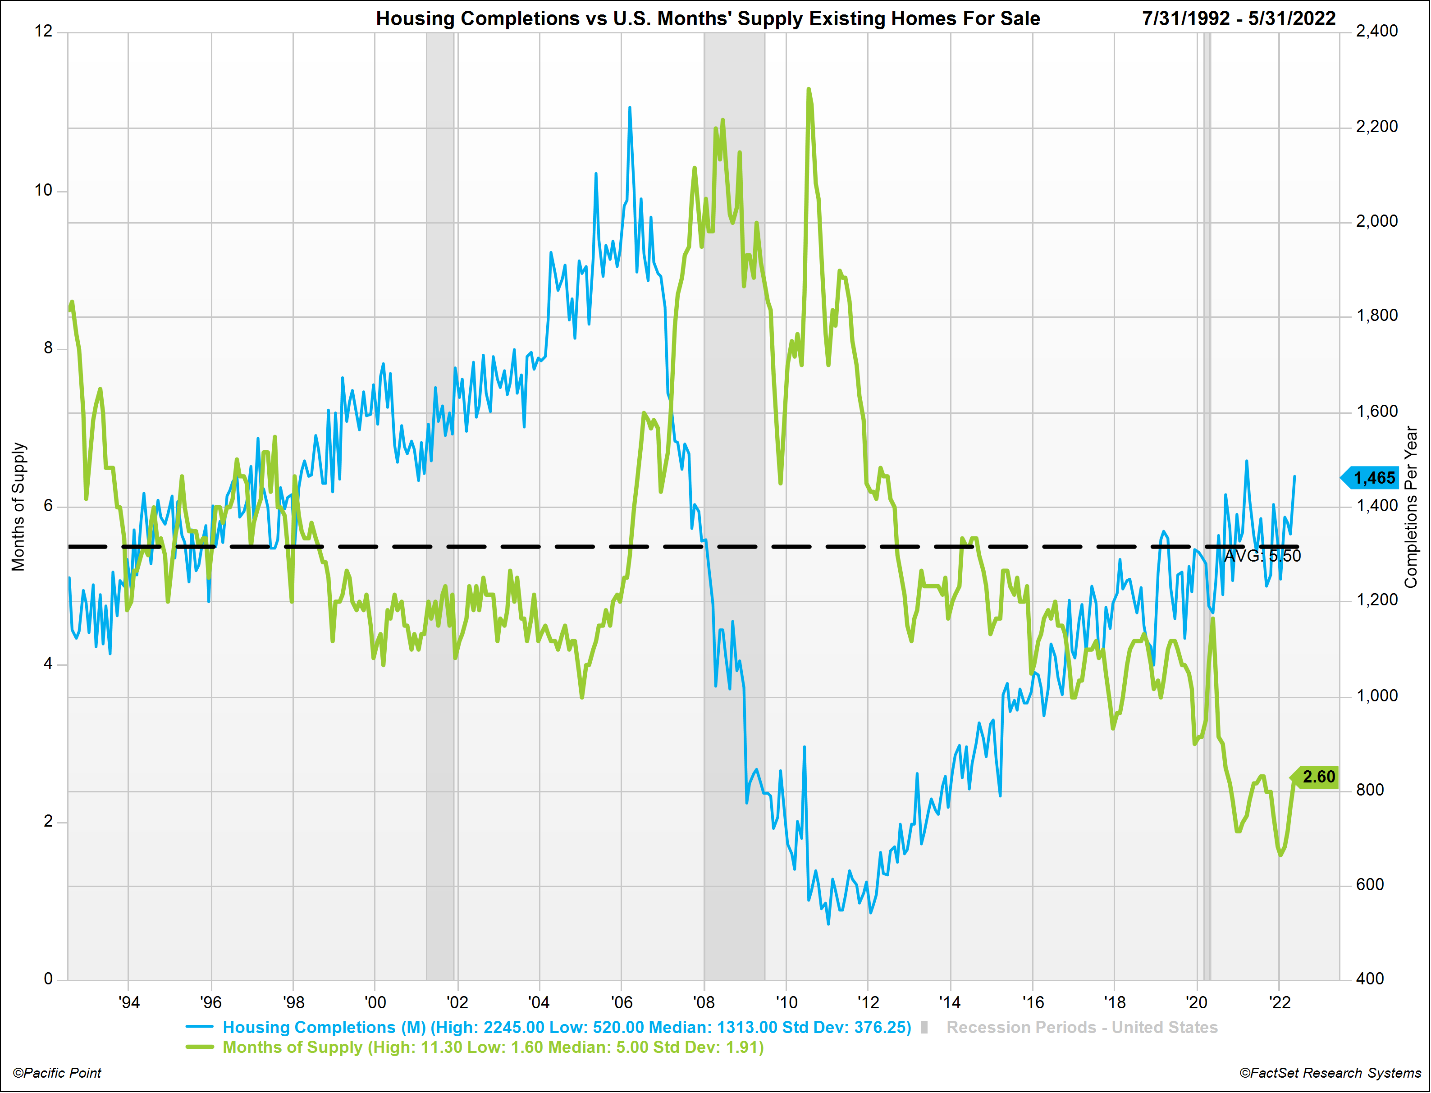
U.S. Months’ Supply of Existing Homes for Sale (green line) reached record high levels, surpassing 11 months in July 2010. With the U.S. real estate market awash in housing supply, homebuilders pulled back on construction, banks tightened lending requirements, and Housing Completions (blue line) plunged to record lows through 2012.
Then, in 2020, the Covid pandemic shocked the real estate market as people were confined to their homes, demanding additional space through an exodus of urban living in favor of suburban and rural areas. Borrowing costs plummeted to record lows driving demand for housing to record highs. The chart below illustrates the supply of existing homes for sale declined 63%, from 4.6 months in May of 2020 to a record 40-year low absorption rate of 1.6 months by January of 2022. We believe this marked the end of the 14-year growth phase of the real estate cycle, and we are now in the maturity phase of the current market cycle.
Please see disclaimer 1.
Dramatic Rise in Interest Rates & Home Prices Reduces Affordability
The real estate cycle, like any other market, is driven by the economic principle of supply and demand. Prior to Covid, U.S. housing supply was already lean relative to demand. This is evidenced by the fact U.S. Months’ Supply of Existing Homes began its steady decline in 2010, reaching new record lows as early as 2017 (see chart on prior page). The Covid pandemic fueled real estate market growth by adding additional demand for housing against a backdrop of 30-year fixed rate mortgages doubling to over 6% by mid-June of 2022.
The chart below illustrates the effects of record high U.S. housing prices colliding with record high 30-year fixed mortgage rates and the resulting year-over-year % change in principal and interest payments rising over 40% in 2022. Historically mortgage payment increases of this magnitude are often a contributor to real estate market cycle maturity as mortgage debt service begins competing with consumption and discretionary spending.
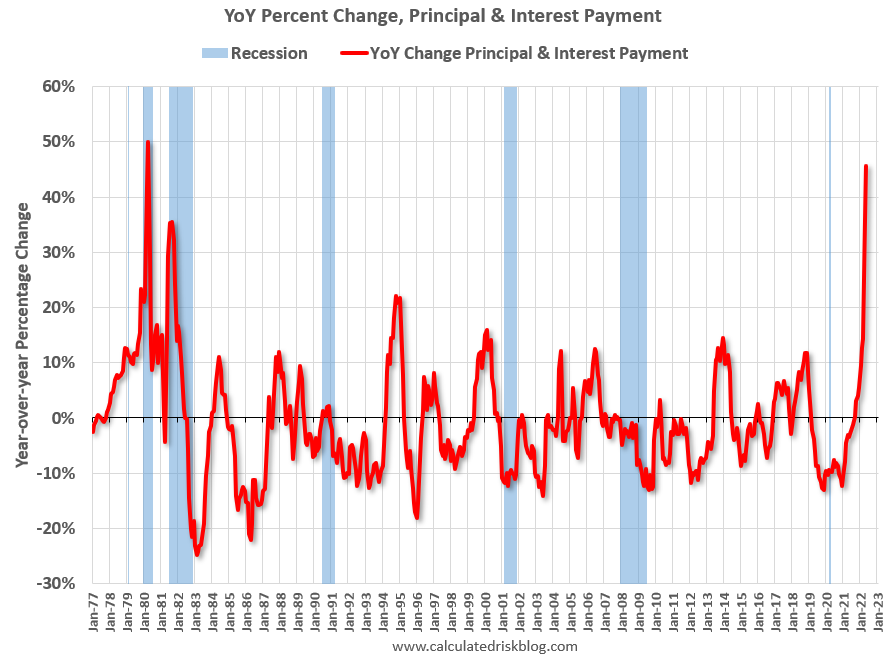
Please see disclaimer 1.
Record Decline in U.S. Housing Affordability
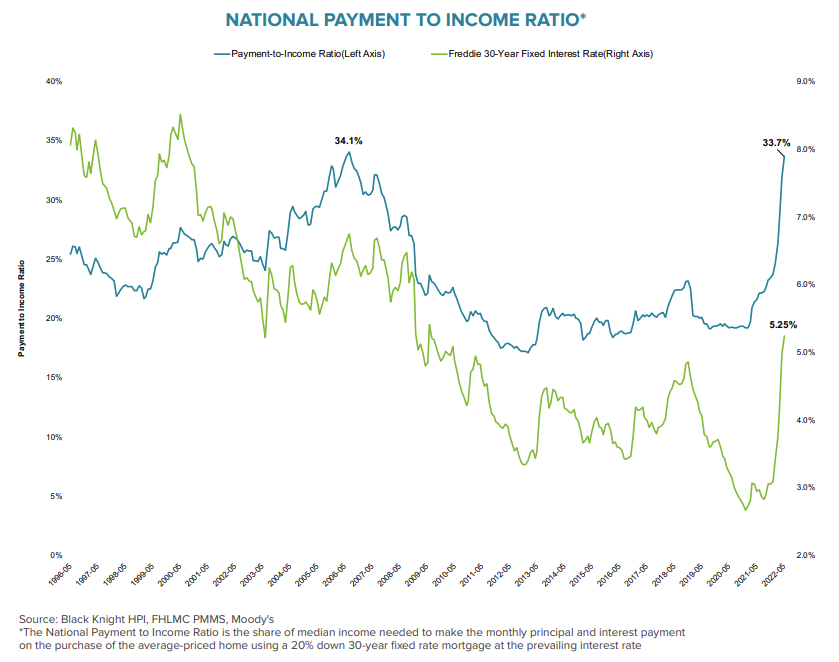
To confirm that we are nearing the maturity phase of the current real estate market cycle, we also look at current values relative to historic trends of monthly principal and interest payments as a % of U.S. median household income and 30-year fixed mortgage rates.
Using the mortgage payment to income ratio as an inverted proxy for the U.S. Housing Affordability Index, the chart below can be used to observe current levels/rates of change relative to historic rates of change, peaks and troughs. We believe the chances of the U.S. entering a recession increase as housing affordability reaches Financial Crisis lows and tapering housing demand begins to weigh on the housing sector representing 15%-18% of annual U.S. GDP.
Please see disclaimer 1.
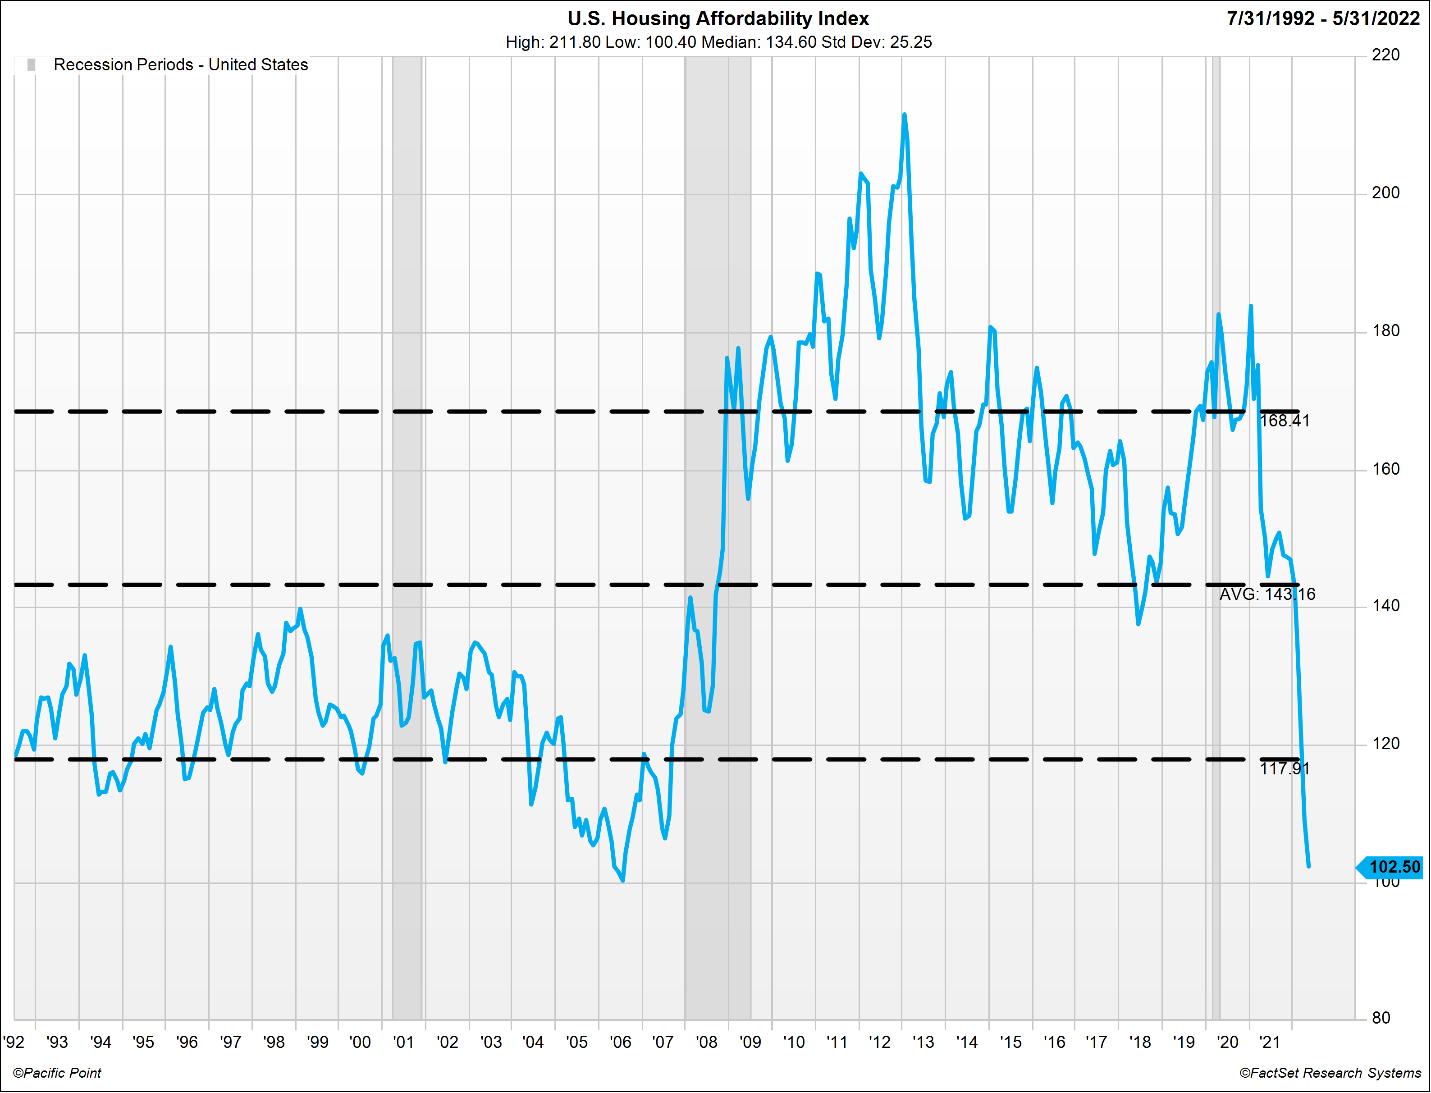
The chart below illustrates the U.S. Housing Affordability Index as reported by the National Association of Realtors. The mean and +1/-1 standard deviation lines are shown as a measure of central tendency illustrating housing affordability index dispersion around its mean over the prior 30 years.
The U.S. Housing Affordability Index serves as a coincidental economic indicator used to assess the sustainability of further housing price increases. Since 1992, the index has averaged 143.3. The current affordability index of 109.2 is well below -1 standard deviation and is approaching the 30-year record low level of 100.4 set 1.5 years before the start of the Financial Crisis. We believe the continued lack of U.S. housing affordability will result in housing demand destruction.
Please see disclaimer 1.
Residential Mortgage Delinquency Rate
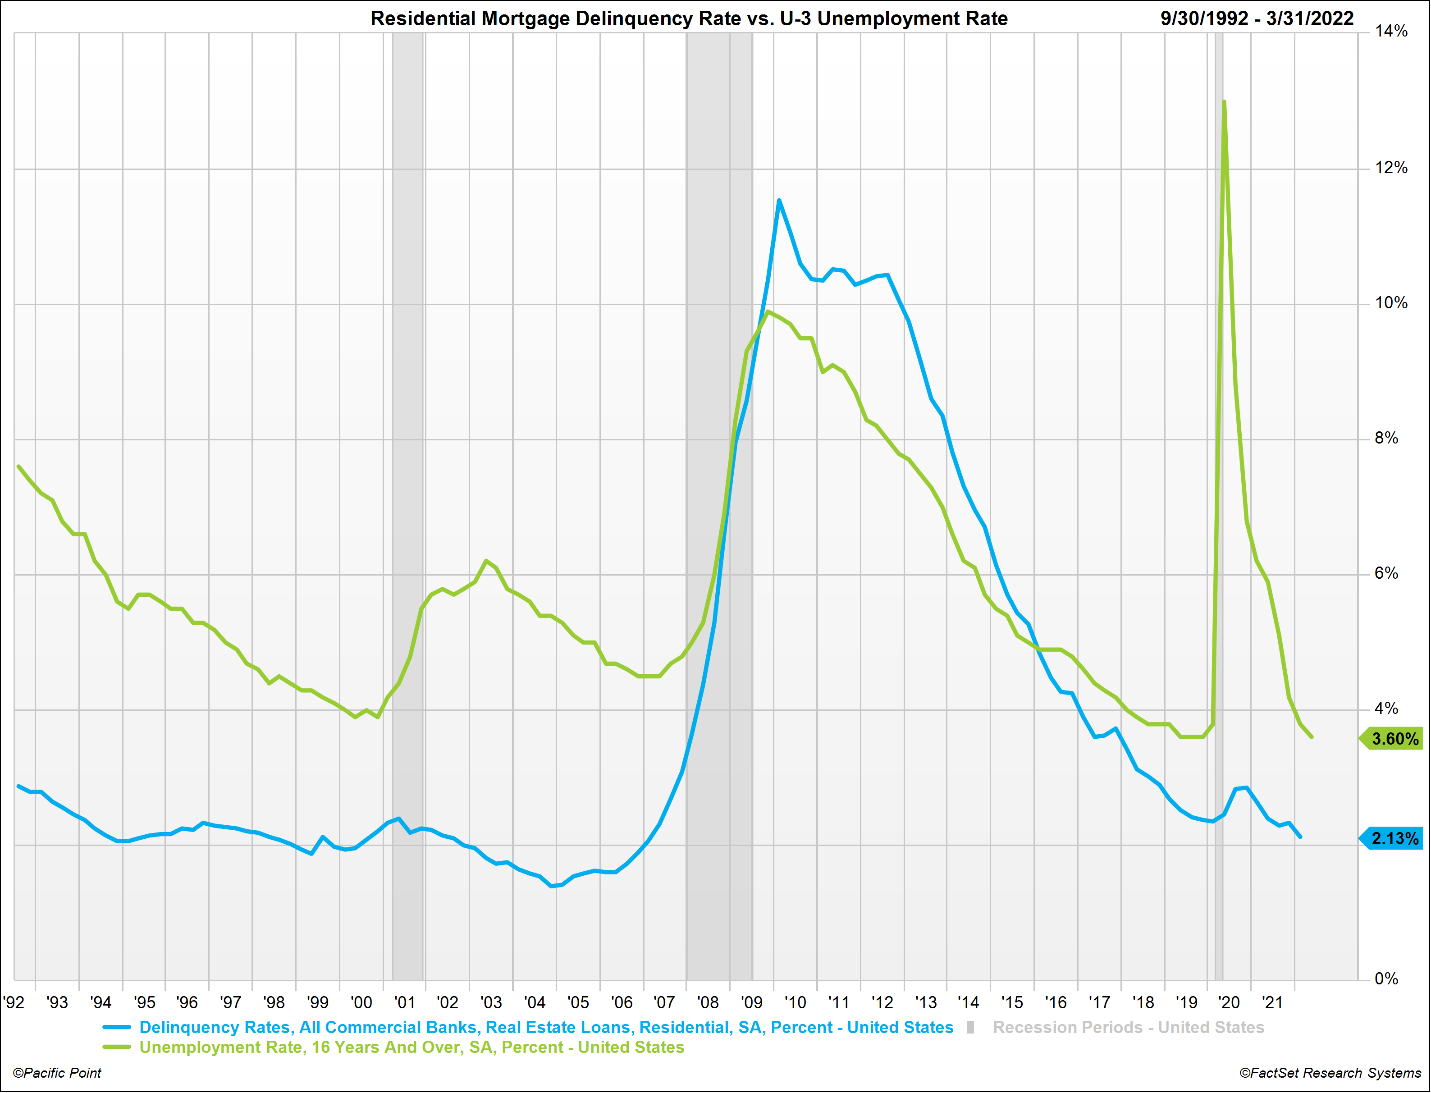
As the U.S. Housing Affordability Index begins to bottom during real estate market cycle maturity, the national mortgage delinquency rate tends to follow. At Pacific Point, we refer to the Residential Mortgage Delinquency Rate as the unemployment rate of the real estate market due to its similar trend and lagging U.S. economic indicator qualities.
The chart below illustrates the tendency for both mortgage delinquency rates and unemployment rates to bottom prior to a recession and reach peak levels by the end of a recession. These are both classic lagging indicators and are metrics that we monitor in conjunction with one another to confirm real estate market cycles relative to larger overall U.S. economic cycles. The U.S. is currently sitting at multi-decade low levels of both delinquencies and unemployment rates in what we believe to be a confirmation of peak real estate market cycle maturity within a larger U.S. economic cycle peak.
Please see disclaimer 1.
Real Estate Rental Rates
No real estate analysis can be complete without a discussion of rental rates. Rental and owner equivalent rental rates are the proxy by which more than 98% of housing costs inputs are measured when calculating the Shelter component of CPI. Outside of a small weight in lodging away from home and tenant/owner insurance, owners’ equivalent rent of residences and rent of primary residence measures represent the Shelter component of CPI.
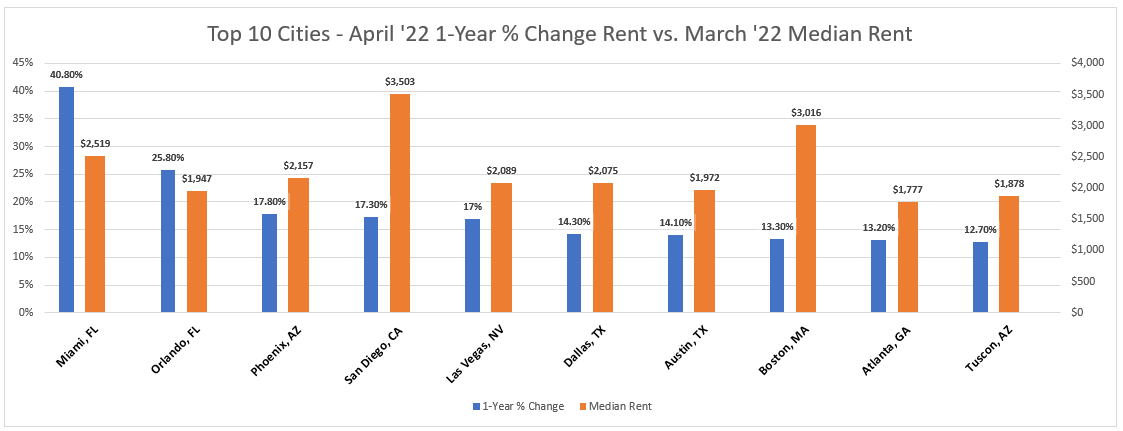
April 2022 marked the 13th month in a row of record-setting rent increases for single-family homes. Rents continue to significantly rise, however unlike housing, there’s no sign of a slow-down yet.
Nationally, single-family rental rates jumped 14% year-over-year in April 2022. The chart below illustrates the top 10 cities where 1-year % change in rents increased the most as of April 2022, and the March median rent price for each.
Please see disclaimer 1.
As home prices increase, rental rates also rise. The timing of rental rate increases lags home values which is likely to add positive inflation bias to inflation readings over the next several months. The chart on the following page illustrates the current year-over-year rental rate changes already exceed pre-Financial Crisis levels. Further increases in rental rates are expected over the coming months.
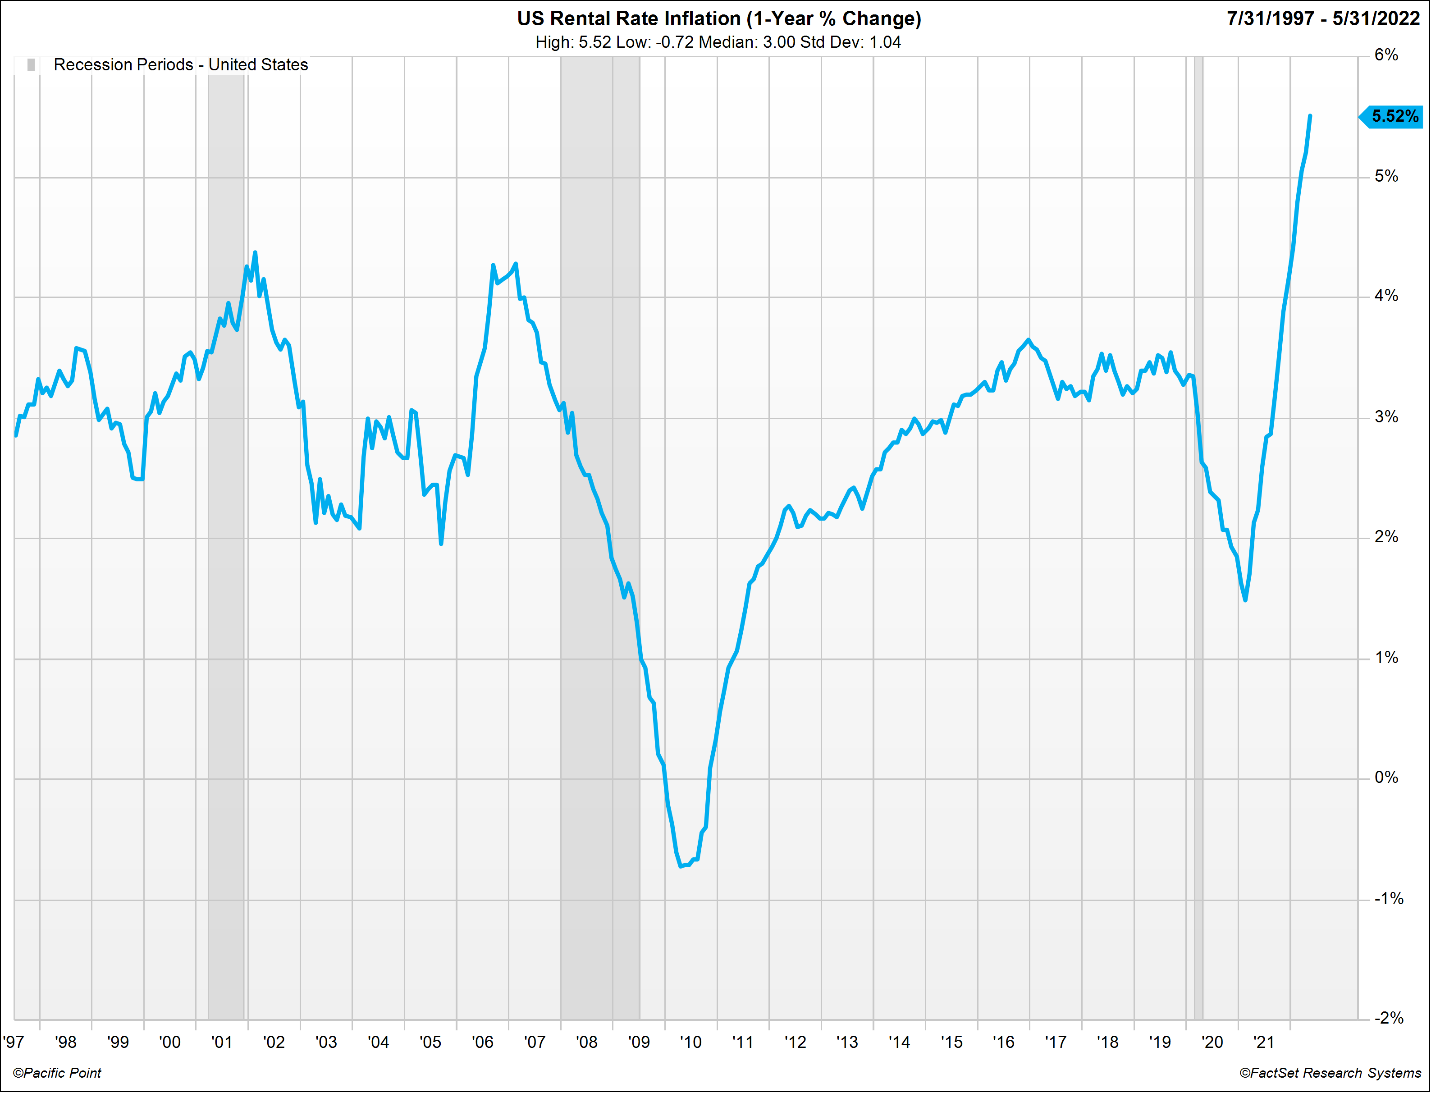
Please see disclaimer 1.
Correction Phase of the Real Estate Cycle Not Expected to be a Repeat of 2008
By all measures presented above, it is hard to deny that home prices appear to be at or near peak valuations. While it remains likely that home values will mean revert alongside the larger U.S. economy, we believe any real estate correction will look very different from what we experienced in 2008.
The Financial Crisis was triggered by the collapse of the subprime mortgage market, which led to a credit crunch in the global banking system and a large decline in global bank lending. The current downturn in asset valuations and U.S. economic activity can be attributed to rising interest rates and quantitative tightening initiated by the Federal Reserve to moderate consumer demand and high inflation.
Today’s real estate market differs in two distinct ways, which we believe will help buffer real estate valuations in the event of a larger U.S. economic downturn or recession.
- Subprime mortgage debt as a % of total mortgage debt outstanding – Subprime mortgage debt outstanding has declined significantly as regulatory changes and ongoing stress tests since the Financial Crisis have discouraged banks from underwriting risky, subprime mortgages. The Federal Reserve Bank of New York issued its most recent housing debt statistics in its Quarterly Report on Household Debt and Credit published May 10, 2002. The report showed there was $859 billion in newly originated mortgage debt in Q1 2022, with 68% of it originated to borrowers with credit scores over 760. Only 2% of newly originated mortgages were originated to subprime borrowers, a sharp contrast to the 12% average seen between 2003-2007. We believe that the longstanding reduction in subprime mortgage exposure since the Financial Crisis will help banks meet liquidity demands in the event of a severe economic shock and should buffer real estate valuations from enduring another 2008-like crisis.
- Supply of U.S. housing – The 30-year chart below illustrates U.S. Months’ Existing Homes for Sale increasing to a record high absorption rate of 11.3 months off the back of the Financial Crisis. The subsequent decline in Housing Completions led to a steady decline in housing supply. By January of 2022, a new record low absorption rate of 1.6 months’ supply of existing homes for sale was set. In our view, housing is a necessary inelastic commodity where the ongoing shortage of housing supply will be met with further demographic driven demand for shelter which should buffer real estate valuations.
Please see disclaimer 1.
At Pacific Point, we have utilized the following two methods of stress testing the current macroeconomic environment to forecast a range of probable changes in home valuations for both ‘soft’ and ‘hard’ landing U.S. economic scenarios:
- Least Squares Regression – Forecast Annual Range of Housing Price Growth
- Long-Term Housing Trends – Forecasting Price Levels
Least Squares Regression – Forecast Annual Range of Housing Price Growth
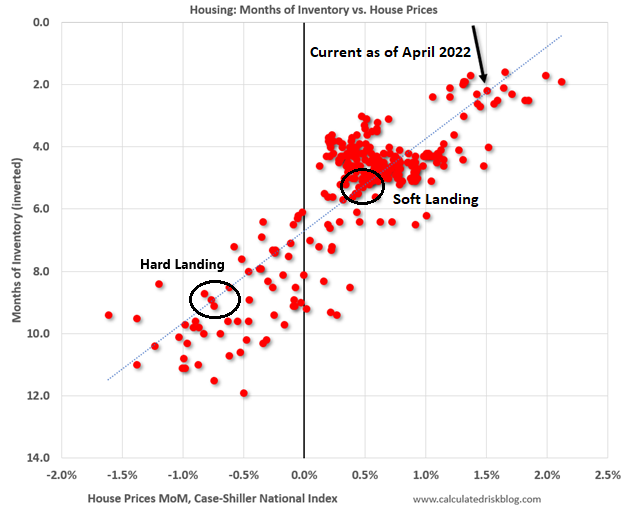
The graph below prepared by calculatedriskblog.com shows months’ supply of existing homes for sale (inverted, from the National association of Realtors) vs. the seasonally adjusted month-to-month price change in the Case-Shiller National Index. Both sets of monthly observations start in January 1999 and end in April 2022. The months of inventory observations are not seasonally adjusted.
The dotted line in the chart below represents the least squares regression that best explains the linear relationship between months’ supply of U.S. housing inventory and the demand for housing in terms of national home prices. The black arrow points to the most recent April 2022 point of 2.2 months’ supply and a 1.5% month-over-month increase in national home prices.
We believe if the Federal Reserve can achieve a soft landing, while maintaining their current Federal Funds Rate and quantitative tightening trajectory, we will see months’ supply of housing move slowly down the regression line and revert to its 30-year mean level of 5.5 months (see chart on previous page). A supply increase of this magnitude would suggest a historic trend of .25% to .50% increase in month-over-month national home prices.
Alternatively, if the Federal Reserve overshoots on their price stability and full employment mandate and causes a hard landing, we will see months’ supply of housing ultimately rise to between 8 and 10 months. A supply increase of this magnitude would suggest a historic trend of -.5% to -1.0% decrease in month-over-month national home prices.
Please see disclaimer 1.
Long-Term Housing Trends – Forecasting Price Levels
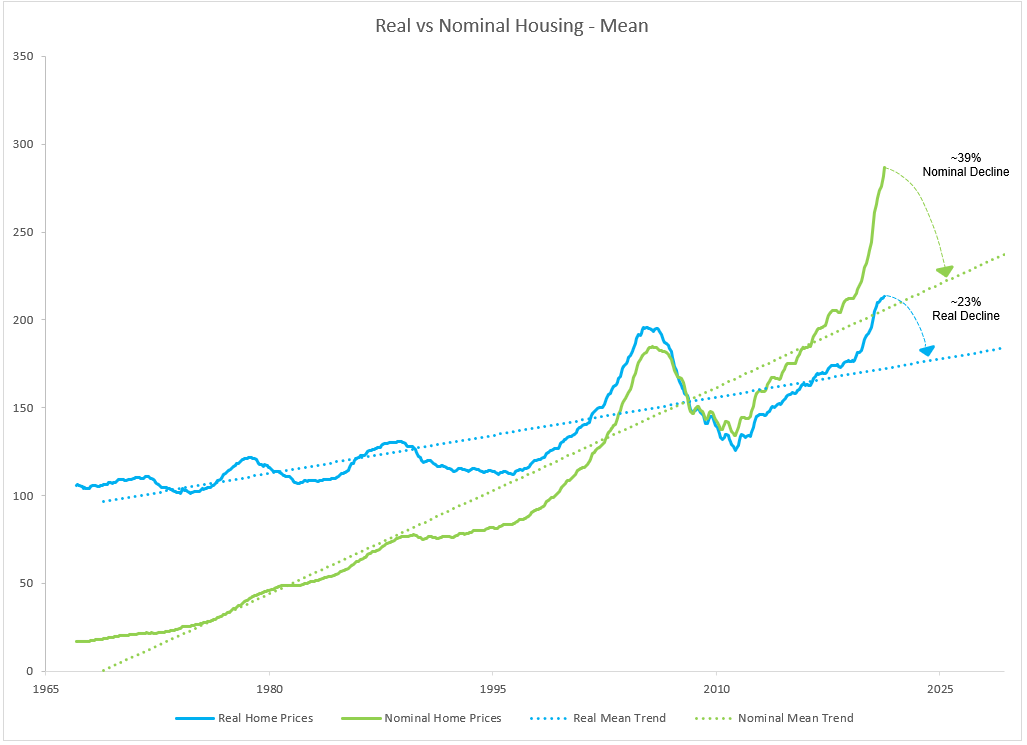
The graph below shows both the real and nominal price change in the Case-Shiller National Indices. Both sets of monthly observations start in 1967 and end in March of 2022.
If the Federal Reserve can achieve a soft landing, while maintaining their current Federal Funds Rate and quantitative tightening trajectory, it seems reasonable to believe that national home prices will decline over time towards the mean trend level of support. Per the chart below, a move of this magnitude is commensurate with a total national average home value decline forecast of -39% over the full cycle (typically 5-7 years), -23% total decline over the full cycle in real terms when adjusted for inflation.
Please see disclaimer 1.
Summary
U.S. real estate is a large and important sector directly influencing nearly 20% of the U.S., with broad implications across the entire economy. At Pacific Point, we manage and invest in a range of real estate related investments, including our secured high-income credit fund, the Pacific Point Realty Fund. As part of our investment process, we rigorously maintain an analytically driven and iterative research process utilizing our in-house team of research analysts. This process helps us form opinions on our real estate related investment opportunities and is designed to surface clues and potential early warning signs about the overall real estate market and the future direction of the U.S. economy.
Historically, accurately forecasting the direction of the real estate market has been difficult. Real estate markets are impacted by a wide range of factors, including local economics, regional and national geographic developments, macroeconomic data such as changes in the national money supply, social and environmental factors such as COVID and many more. Over the years, our data-intensive analytical framework has provided valuable insights and actionable investment ideas. As such, we intend to update this playbook periodically as facts and circumstances change.
To learn more about the Pacific Point Real Estate Fund, please visit:
https://www.pacificpoint.net/private-credit/=
General Disclaimer
This report is not an offer to sell securities of any investment fund, a solicitation of offers to buy any such securities, or a solicitation to open a separately managed account with Pacific Point Advisors, LLC (“Pacific Point”). There are risks associated with investing in Real Assets and the Real Assets sector, including real estate, precious metals and natural resources. Investments can be significantly affected by events relating to these industries.
Reference to a strong track record is based on a performance track record since the inception of the applicable funds and/or strategies. Please contact us if you have any questions. Past performance shown is not indicative of future results, which could differ substantially.
Private funds (or other alternative investment funds) are designed only for sophisticated investors who are able to bear the risk of the loss of their entire investment. An investment in a Private fund should be viewed as illiquid and interests in Private funds are generally not readily marketable and are generally not transferable. Investors should be prepared to bear the financial risks of an investment in a Private fund for an indefinite period of time. An investment in a Private fund is not intended to be a complete investment program, but rather is intended for investment as part of a diversified investment portfolio. Typically interests in a Private fund are not registered under the US Securities Act of 1933, as amended (“the Securities Act”), and the fund is not registered as an investment company under the US Investment Company Act of 1940, as amended (the “Investment Company Act”), and as such, investors will not be afforded the protections of those laws and regulations. A prospective investor should carefully review all offering materials associated with a Private fund, including the risk factors, and should consult his or her own legal counsel and/or financial advisor prior to considering an investment in a Private fund.
The information in this presentation was prepared by Pacific Point and is believed by Pacific Point to be reliable and has been obtained from public sources believed to be reliable. Pacific Point makes no representation as to the accuracy or completeness of such information. Opinions, estimates and projections in this presentation constitute the current judgment of Pacific Point and are subject to change without notice. Any projections, forecasts and estimates contained in this presentation are necessarily speculative in nature and are based upon certain assumptions. It can be expected that some or all of such assumptions will not materialize or will vary significantly from actual results. Accordingly, any projections are only estimates and actual results will differ and may vary substantially from the projections or estimates shown. This presentation is not intended as a recommendation to purchase or sell any security. Pacific Point has no obligation to update, modify or amend this presentation or to otherwise notify a reader thereof in the event that any matter stated herein, or any opinion, project on, forecast or estimate set forth herein, changes or subsequently becomes inaccurate.
This research report is strictly confidential and may not be reproduced or redistributed in whole or in part nor may its contents be disclosed to any other person without the express consent of the Pacific Point.
ALL STATEMENTS IN THIS PRESENTATION ARE THE OPINIONS OF PACIFIC POINT, UNLESS OTHERWISE SPECIFIED.
Additional Disclaimers
Disclaimer 1 – Graphs and Charts
The graphs, charts and other visual aids are provided for informational purposes only. None of these graphs, charts or visual aids can and of themselves be used to make investment decisions. No representation is made that these will assist any person in making investment decisions and no graph, chart or other visual aid can capture all factors and variables required in making such decisions.
Disclaimer 2 – Forward Looking Statements/Projections
Any projections, forecasts, objectives and estimates contained in this document are necessarily speculative in nature and are based upon certain assumptions. In addition, matters they describe are subject to known (and unknown) risks, uncertainties and other unpredictable factors, many of which are beyond Pacific Point’s control. No representations or warranties are made as to the accuracy of such forward-looking statements. It can be expected that some or all of such forward-looking assumptions will not materialize or will vary significantly from actual results. Accordingly, any projections are only estimates and actual results will differ and may vary substantially from the projections or estimates shown. This presentation cannot and does not guarantee or predict a similar outcome with respect to any future investment.